Post stratification on a low density species

Javier García Reynaud

Eric Rexstad
Javier
Welcome to the email list.
I think you might be making your analysis too complicated by incorporating post-stratification. What is your objective: do you want to produce monthly estimates of abundance, that seems problematic given your comment that there are months when you have no detections.
I recognise that the example data you
provide is not the real data, but you say it is indicative of
the number of monthly detections and the inaccurate distance
measurements. It is challenging that you can produce defensible
monthly estimates of abundance from this small number of
replicate transects. It would have been preferable to have
three times the number of transects one-third the length to
improve the estimates of encounter rate variability.
You also note the observers round to
favoured distances (0, 5, 10, 15, ...) with the spike (30% of
all detections) at distance 0 being most problematic 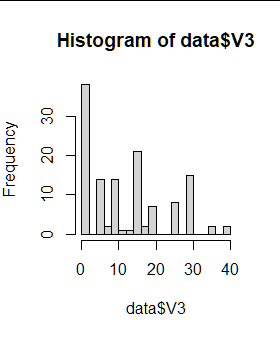
The detections by month are also challenging
Apr Aug Dec Feb Jan Jun Mar March
May Nov Oct Sep
35 2 2 2 1 34 4 1 40
2 2 2
If detectability of birds changes dramatically between breeding and nonbreeding season, resulting in the difference in number of monthly detections, you'll be hard pressed to produce abundance estimates for the months when there are so few detections.
Recognising the data you have provided is
just an example, 119 of 127 detections were made in
Apr/May/Jun. The remaining 18 detections will have little
influence upon the fitted detection function. Perhaps best to
use the 119 detections to make an estimate of the number of
birds during the breeding season. As I say, there is little to
say outside those three months.
--
You received this message because you are subscribed to the Google Groups "distance-sampling" group.
To unsubscribe from this group and stop receiving emails from it, send an email to distance-sampl...@googlegroups.com.
To view this discussion on the web visit https://groups.google.com/d/msgid/distance-sampling/bf680ea2-3591-4337-88a8-334a042e808an%40googlegroups.com.
--
Eric Rexstad
Centre for Ecological and Environmental Modelling
University of St Andrews
St Andrews is a charity registered in Scotland SC013532
Javier García Reynaud
Hi Eric:
Thank you very much for your prompt reply. Seeing how carefully you reviewed the data, I think I was very hasty in sending you my questions without having the actual table of field data. I have been typing in the pending data in the last hours and I am attaching the real data to this communication.
The main objective of the study is to estimate the density of quetzals in the sectors with tourist loads (which is the reason why 5 transects were selected, and also because of that, the selection was non-random, I should add), so, although the monthly data are available, the ones from the months with very few detections could be discarded, as you note, if not useful to achieve the density/number of birds. Thank you very much for that insight.
The question that arises when analyzing your answer is: if only the combined data of the reproductive season were used without labeling them as repetitions, wouldn't Distance interpret them as if all the observations were made at a single moment, and would thereby overestimate the density result? How can the data from the months with the highest number of detections be used without falling into this overestimation of density?
Finally, the attached data still shows, for clarity purposes, a column at the observation level where it is detailed to which month the detection corresponds, there is also a final column called A or B, and this is because the transect was traveled from " round trip" each visit, so the observations labeled A were made when traveling the transect first thing in the morning and those labeled B upon return. Is data B somehow usable or should it be discarded?
Thank you very much again.
Eric Rexstad
Javier
Thanks for sending along your complete data set. Let me address your question regarding the calculation of sampling effort, then I will make a few additional comments.
Your details regarding the sampling
protocol are absolutely essential to properly computing effort.
In your most recent message, you note that the transects were
traversed "out and back" with detections recorded when
travelling in both directions. This means that for each of your
monthly surveys, the length of the transects should be doubled
because effort was expended both going out and coming back along
the transect. Note that the vast majority of the detections
(100 vs 22) were on the outbound leg.
Furthermore, if we were to combine the data from the three monthly surveys during the breeding season, April, May, June; we would triple the effort computed previously to account for the transects being visited in three months.
In the R language, here is how I would adjust your original file to exclude non-breeding season detections and to properly compute effort:
quetzal <-
read.csv("LaTigraPharomachrusMocinno.csv")
names(quetzal) <- c("TranID", "Sample.Label", "Effort",
"distance", "when", "outback")
quetzal.breed <- quetzal[quetzal$when %in% c("Abr-20",
"May-20", "Jun-20"),]
quetzal.breed$Effort <- quetzal.breed$Effort*3*2
Now, for some general comments.
With a small number of replicate transects and with those transects being non-randomly placed; there is little you can say about the density of your birds beyond the transects you sampled. Non-random transect placement (and the small number of replicate transects) means you cannot imply that the places you sampled are representative of the places you did not sample. You can conduct this survey again in the 2021 breeding season on these transects and compare the abundance estimates between years within the area covered by your transects. But your inference cannot extend to areas outside your sampled transects.
I performed a quick analysis of the breeding season survey. As you noted, there is severe rounding to favoured distances, but here is the fit of a half-normal detection function to the exact distances:

The fitted half-normal model bends
downward only slightly, suggesting about 90% of the birds within
35m of the transect are detected. Do you find that number
biologically plausible?
Surprisingly, this half-normal model fitted to the exact distances adequately fits the data
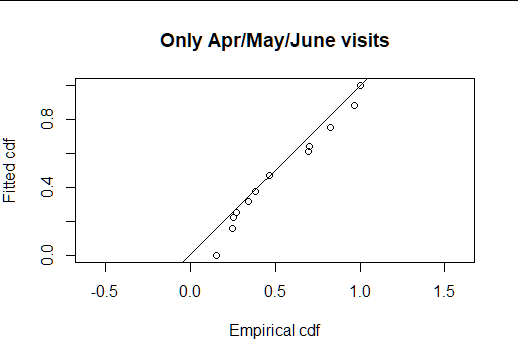
Cramer-von Mises test P-value=0.064. The
122 detections divided by the 0.90 probability of detection
results in an estimate of 136 birds in the covered area.
To view this discussion on the web visit https://groups.google.com/d/msgid/distance-sampling/2a267792-a303-45a4-a6f3-5105604d1e33n%40googlegroups.com.
Eric Rexstad
To complete the story (pressed 'send' too soon)
How would you compute density by hand, from the previous calculations. Distance for Windows software will do this if you have your effort recorded properly.
How much area was covered by the survey effort? The maximum distance (truncation distance) for the breeding season is 35m. The total length of the five transects adjusted for the six traverses is 48840m. So the area (in meters) covered by the survey is length x width (on both sides)
2 * 35 * 48840 = 3,418,800 square meters
or 341.88ha
The density of birds in the covered area
is the 136/341.88=0.398 birds per hectare.
To view this discussion on the web visit https://groups.google.com/d/msgid/distance-sampling/aedc0d69-169f-36fc-728a-b0c99fb0da27%40st-andrews.ac.uk.