Over-estimation of population densities
77 views
Skip to first unread message

Kah Ming Teo
Nov 19, 2021, 3:45:30 AM11/19/21
to distance-sampling
Hi all,
I'm currently Distance software on Windows to estimate the population densities of 5 species of birds in a certain region that was surveyed using 5-min point counts. But the results that I get look much higher than possible. I have a few questions and would like to seek someone's advice on how to fix the issue of over-estimation.
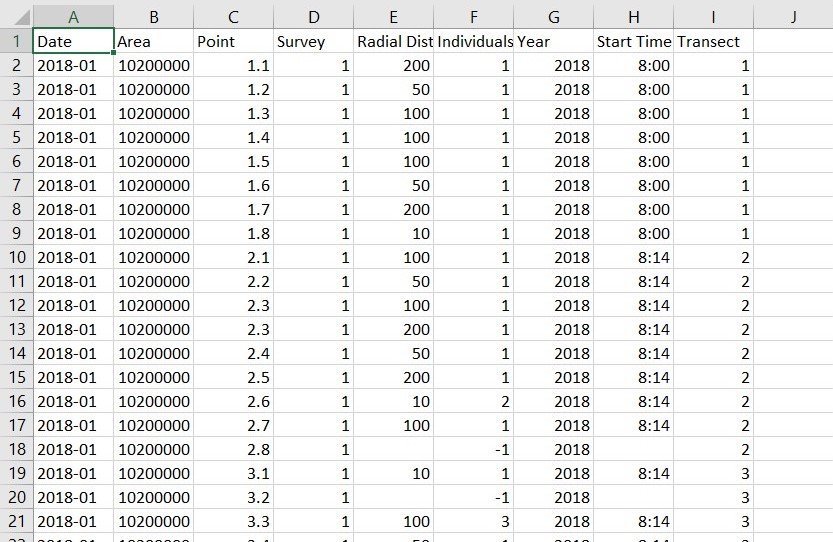
Each analysis is performed separately on each species individually using CDS. Data is being collected monthly over a span of 2 years. (survey effort = 24 per yr, 1 per mth). Data used for analysis is being sorted by month, then by point. survey effort has been put as 1. (Should survey effort be 1 or 24 if data is sorted by month, not by points? -> I noticed that Point 1.1 is being treated as a different point by software if they aren't arranged together in data. Since it's sorted by months, they are separated. I've tried sorting by points, and survey effort = 24 and I got similar values.) Distance data was binned, 10m, 50m, 100m, 200m. Intervals of 0 - 10m, 10 - 50m, 50 -100m, 100 - 200m were created.
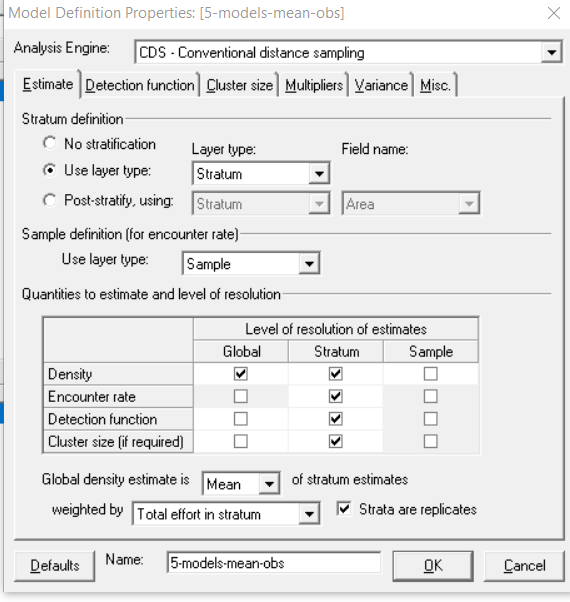
All the possible combinations of Key Functions and Series Expansions have been used. (4 x 3 models). I've selected AICc for model selection, although selecting AIC didn't seem to fix the issue. I have stratified my data by month in the system, adjustment terms were automated selection, with max 5 terms, and Strictly monotonically non-increasing was selected for Constraints. For Cluster Size, means of observed clusters were selected.
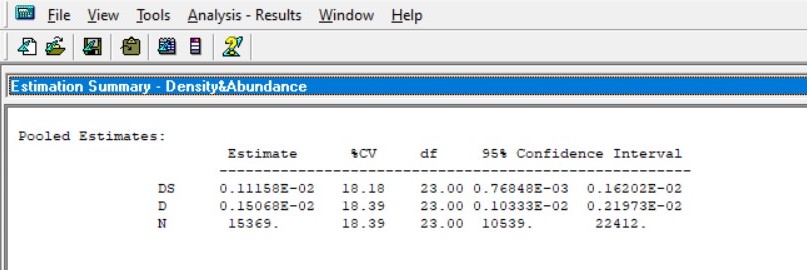
Here's the result I got (pooled estimate). I also have the estimates for each month. I've looked at the Chi-square GOF for the model for each month and some of them were p = -1.0000 or p = 0.0000. (indicating over-fitting or perfectly fitting models? Either way is not a good model - please correct me if I'm wrong.)
I've tried truncating my data at 100m (As data is binned, 10% will automatically truncated all 200m data, which is equivalent to truncating at 100m.) But the estimates were no less ridiculous.
I would greatly appreciate any advice on how to fix such problem. Thank you for taking the time to read and troubleshoot!
kmteo
Dec 19, 2021, 11:01:49 AM12/19/21
to distance-sampling
Hi all,
I would like to update regarding my query, following my discussion with Eric so far. (Thanks Eric for your advice!)
While the results were still larger than the expected density/abundance, there were some advice and comments that Eric offered which were useful.
- To check the number of detections per month before using the monthly data for analysis. The number of detections has to be sufficient in order to analyse the data month-by-month. If the number of monthly detections is sufficient, it is not necessary to use the pooled detection function. Using pooled detection function would invalidate the monthly estimates.
- The data with which Eric has used to troubleshoot was for a hornbill species, which calls loudly. Negative exponential function would not be biologically feasible since the function gives a detectability model that falls away too quickly. This will result in an over-estimation of the figure as the model presumes that you detect only a small percentage of birds.
- The effects of overlapping points do not affect the outcome significantly according to Buckland (2006) so it's not required to adjust for overlapping points.
- Large flocks that occur very occasionally create large uncertainty to the average group size.
Buckland, S. T. (2006). Point transect surveys for songbirds: Robust methodologies. The Auk, 123(2), 345–357. https://doi.org/10.1093/auk/123.2.345
Regards,
Kah Ming
Reply all
Reply to author
Forward
0 new messages