R packages for fitting distance sampling functions

Maik Henrich

Eric Rexstad
Maik
There are lots of topics packed into this
message. There seems to be two main issues:
- you want a particular parameter estimate (effective detection radius) to use with Rowcliffe's REM abundance estimate for camera traps and
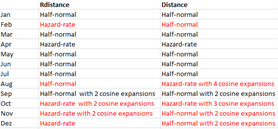
- selected monthly detection function models differ between software used to fit detection functions.
I'll address the second question first. Modelling detection functions involve many decisions, some objective and some subjective. There are many reasons that different detection functions might be chosen for a given set of data. Those reasons include choices the analyst (you) made: same truncation distance for both analyses. Differences in the algorithm used by the software to produce the maximum likelihood estimates can produce different selected models.
There are several items you do not report in your comparison table: what is the magnitude of delta AIC scores in the comparisons. Recognise that choice of preferred detection function for a data set is not an automated process: AIC is a tool to aide in model selection, you need to bring your biological insight to the process as well.
If the data are "well behaved", there is unlikely to be a demonstrable difference in EDR estimates between models that are close in AIC score. This is particularly true if you take into account the uncertainty in estimated EDR. Consequently, the impact of the ambiguity in model choice upon your estimates of population abundance I suspect is small relative to the uncertainty in the abundance estimate.
Regarding performing analyses twice with different R packages. That seems to be extra work resulting in the situation in which you find yourself. Recently, I wrote a function that computes EDR and its confidence interval for use with detection function objects produced by the Distance package. Perhaps this will address the first of your issues:
https://github.com/DistanceDevelopment/mrds/issues/36#issuecomment-753462999
Let me know if this function does what you
want it to do.
--
You received this message because you are subscribed to the Google Groups "distance-sampling" group.
To unsubscribe from this group and stop receiving emails from it, send an email to distance-sampl...@googlegroups.com.
To view this discussion on the web visit https://groups.google.com/d/msgid/distance-sampling/3553f763-30fb-4661-be69-4bf4111f956bn%40googlegroups.com.
--
Eric Rexstad
Centre for Ecological and Environmental Modelling
University of St Andrews
St Andrews is a charity registered in Scotland SC013532
Maik Henrich
Eric Rexstad
Maik
Because P_a is bounded by zero, it is
plausible that the confidence interval bounds could be computed
in the manner you describe. However, as I noted in my reply to
you on 15Feb21, I don't think you would use the confidence
interval bounds as the range from which to perform a parametric
bootstrap
I do not know the mechanics of the REM
computations; so I don't know how many components of uncertainty
are involved in deriving the uncertainty for your abundance
estimates. Consider the suggestions Prof Buckland made in his
email of 15Feb21 regarding non-parametric bootstrapping
approaches you might consider.
To view this discussion on the web visit https://groups.google.com/d/msgid/distance-sampling/577ca19e-5fe8-4693-9ff0-f1050971cd54n%40googlegroups.com.

Eric Howe
Maik Henrich

Stephen Buckland
If you’re using camera traps and taking just one distance for each detected animal, you will biased estimation whatever software you are using. The reason for this bias is given in
Howe, E.J., Buckland, S.T., Després-Einspenner, M.-L. and Kühl, H.S. 2017. Distance sampling with camera traps. Methods in Ecology and Evolution 8, 1558-1565.
If you fit the same model with the same constraints (if any) on parameters and the same truncation distance in two different software packages, then you need to check that both packages use exactly the same form of AIC, with any constant terms in the likelihood treated identically. If that is the case, then the most likely reason for a difference is if one analysis has not converged, in which case the analysis with the smaller AIC should be the better.
Steve Buckland
--
You received this message because you are subscribed to the Google Groups "distance-sampling" group.
To unsubscribe from this group and stop receiving emails from it, send an email to
distance-sampl...@googlegroups.com.
To view this discussion on the web visit https://groups.google.com/d/msgid/distance-sampling/262cc61f-1aaf-4c75-accc-18a80f8dcd9en%40googlegroups.com.

Len Thomas
are (a) monotonicity and (b) scaling.
For monotonicity, it seems reasonable to constrain the fit so the
detection probability does not go up with increasing distance. This is
set with the monotonicity argument of the ds() function in Distance, and
is on by default when you don't have covariates. I have not used
Rdistance, but on first glance at the help file it appears not to have
the ability to enforce this constraint. So, if your data has any
"bumps" in detection frequency with increasing distance, you'll get a
different fit with the two packages.
For scaling, the way the adjustment term functions are affected by
distance depends on how the distances are scaled. This only matters
when you have covariates so is likely not an issue here (judging from
what you wrote). One explanation and illustration of this is in the
following paper.
Marques, T.A., L. Thomas, S.G. Fancy and S.T. Buckland. 2007. Improving
estimates of bird density using multiple covariate distance sampling.
The Auk 127: 1229-1243. https://doi.org/10.1093/auk/124.4.1229
Cheers, Len
On 26/02/2021 14:34, 'Stephen Buckland' via distance-sampling wrote:
> If you’re using camera traps and taking just one distance for each
> detected animal, you will biased estimation whatever software you are
> using. The reason for this bias is given in
>
> Howe, E.J., Buckland, S.T., Després-Einspenner, M.-L. and Kühl, H.S.
> Evolution/ *8*, 1558-1565.
> If you fit the same model with the same constraints (if any) on
> parameters and the same truncation distance in two different software
> packages, then you need to check that both packages use exactly the same
> form of AIC, with any constant terms in the likelihood treated
> identically. If that is the case, then the most likely reason for a
> difference is if one analysis has not converged, in which case the
> analysis with the smaller AIC should be the better.
>
> Steve Buckland
>
> [mailto:distance...@googlegroups.com] *On Behalf Of *Maik Henrich
> *Sent:* 26 February 2021 14:25
> *To:* distance-sampling <distance...@googlegroups.com>
> *Subject:* {Suspected Spam} [distance-sampling] Re: R packages for
>
> Dear Eric Howe, dear Eric Rexstad,
>
> Thank you both for you comments!
>
> In our dataset, distances to an animal were measured only once for each
> independent observation, so the independence assumption should not be
> violated.
>
> I am still wondering about the different results that I get with
> "Rdistance" or "Distance", although I am using the same data, the same
> truncation distance and the same function. For the November dataset for
> example, the delta AIC for the half-normal function with two cosine
> adjustment terms between "Rdistance" and "Distance" is 2.13.
>
> The "Rdistance" results look better to me, but of course that is a very
> subjective judgement.
>
> Are there other objective criteria that could bee used together with the
> AIC and how much weight should they be given in relation to each other?
>
> All the best,
>
> Maik
>
>
> I would very much appreciate to hear your thoughts on this and
> I am very thankful for all suggestions of possible solutions.
>
> All the best,
>
> Maik
>
> --
> You received this message because you are subscribed to the Google
> Groups "distance-sampling" group.
> To unsubscribe from this group and stop receiving emails from it, send
> an email to distance-sampl...@googlegroups.com
> https://groups.google.com/d/msgid/distance-sampling/262cc61f-1aaf-4c75-accc-18a80f8dcd9en%40googlegroups.com
> --
> You received this message because you are subscribed to the Google
> Groups "distance-sampling" group.
> To unsubscribe from this group and stop receiving emails from it, send
> an email to distance-sampl...@googlegroups.com
> <https://groups.google.com/d/msgid/distance-sampling/AM8PR06MB758552205A1A2FC4BB4DF8ACC59D9%40AM8PR06MB7585.eurprd06.prod.outlook.com?utm_medium=email&utm_source=footer>.
--
Len Thomas len.t...@st-andrews.ac.uk lenthomas.org @len_thom
Centre for Research into Ecological and Environmental Modelling
and School of Mathematics and Statistics
The Observatory, University of St Andrews, Scotland KY16 9LZ
Office: UK+1334-461801 Admin: UK+1334-461842
While I may be sending this email outside of my normal office hours,
I have no expectation to receive a reply outside of yours.
The University of St Andrews is a charity
registered in Scotland, No SC013532.
Maik Henrich
Stephen Buckland
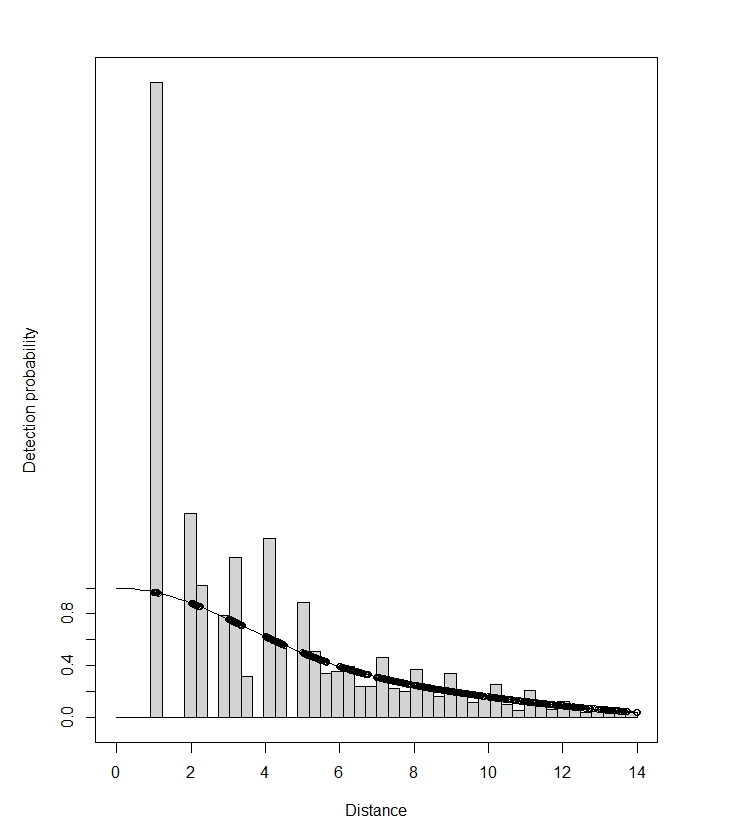
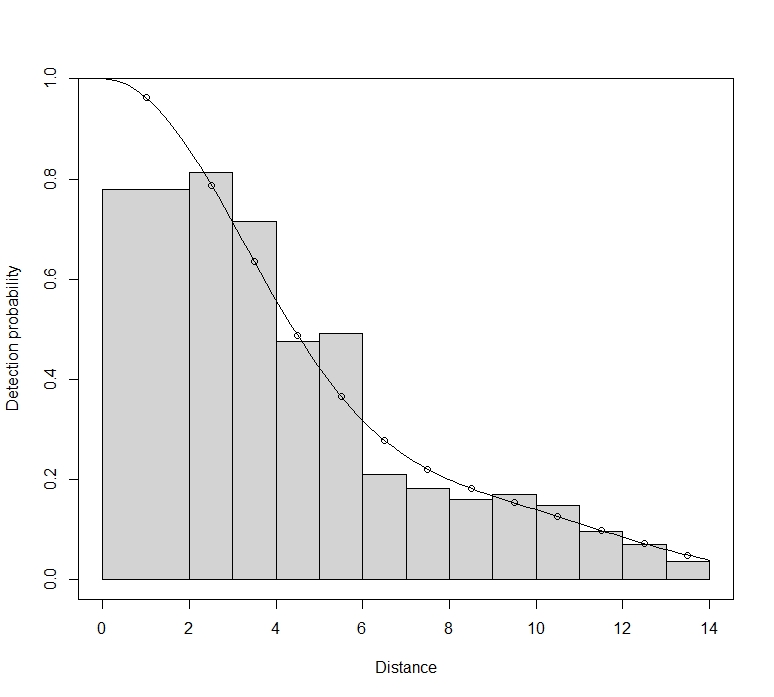
Maik, this does indeed show bias. You have a large spike of detections at very short distance. (The spike isn’t as bad as it appears, as the pdf plot is the one to look at for possible poor model fit. The histograms bars at short distances get scaled up when plotting the detection function fit.) Animals that approach the camera from behind will first be detected at very short distances as they pass the camera. This bias probably is a result of you taking just one measurement per animal.
With a spike at zero, you have to be careful with the hazard-rate model. It can fit very large spikes even when those spikes are a result of biased recording (as is likely here), or a result of attraction to the camera. It may well be that Distance and RDistance set different lower bounds for the hazard-rate shape parameter, and this will result in very different estimates when that lower bound is reached – as happens when data are spiked like yours.
You can go through model selection for each bootstrap resample – it means that your precision estimates incorporate model uncertainty. However, given the artificial spike in your data, I would not include the hazard-rate model in your set of possible models. It is too good at fitting spikes, and giving you a detection function that falls improbably fast with distance from the camera.
Steve
From: distance...@googlegroups.com [mailto:distance...@googlegroups.com] On Behalf Of Maik Henrich
Sent: 04 March 2021 11:40
To: distance-sampling <distance...@googlegroups.com>
--
You received this message because you are subscribed to the Google Groups "distance-sampling" group.
To unsubscribe from this group and stop receiving emails from it, send an email to
distance-sampl...@googlegroups.com.
To view this discussion on the web visit
https://groups.google.com/d/msgid/distance-sampling/136a5be5-e785-45e0-81e7-06f8eadd87d9n%40googlegroups.com.
Maik Henrich
Stephen Buckland
I think that would reduce the bias. Difficult to say how much bias might remain.
To view this discussion on the web visit https://groups.google.com/d/msgid/distance-sampling/c2074220-b7a9-4c10-8de6-69af787901e8n%40googlegroups.com.
Maik Henrich
Stephen Buckland
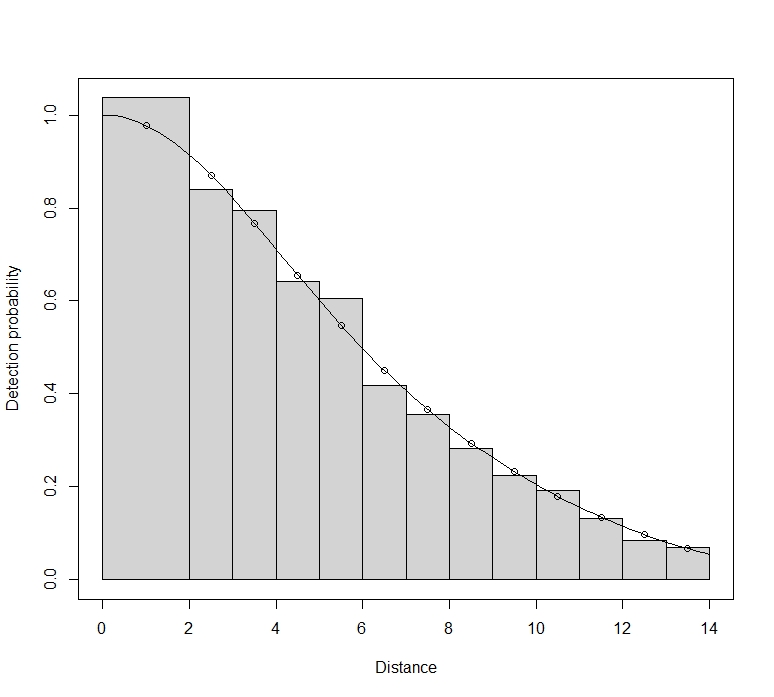
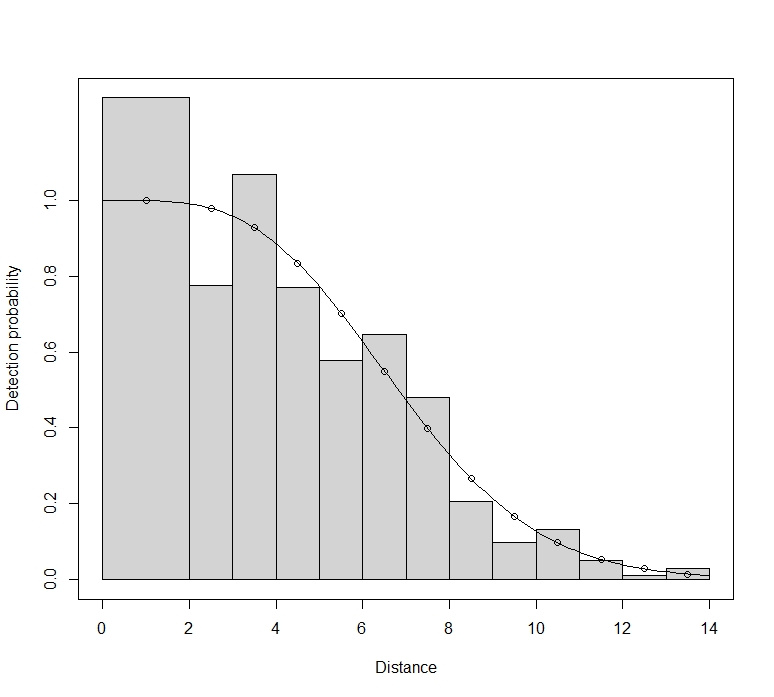
Maik, you should not reject bootstrap replicates with a poor fit. You have a large sample size. Small departures from the true model will therefore translate to significant goodness-of-fit tests. Here, the apparent lack of fit is probably a result of small rounding errors in your distances, and are not anything to worry about. Part of the problem may be that you have selected interval endpoints that equate to a whole number of metres. For setting intervals for goodness-of-fit tests, you need to avoid values that correspond to favoured rounding distances.
To view this discussion on the web visit https://groups.google.com/d/msgid/distance-sampling/98ec25c3-7749-4951-9776-58837f1320a9n%40googlegroups.com.