Camera Trap Data & GoF

Carolin Klangwald
Hello everyone,
a while ago I asked a question here while working on camera trap data collected 2020 around lake shores in southern Finland. The aim was to achieve density estimates via distance sampling for the Racoondogs in the area. For my master’s thesis I now received the survey data / videos from the same area collected in 2021. I am aiming to repeat the analyses for the Racoondogs, as well as Foxes and Badgers in the area. However, I cannot find a model that passes GoF. I am not sure what I am missing, as I am encountering the same issue with all 3 species, even though the distributions are different. Please find the results for the racoondogs in the attachment.
I am working mostly in
R, after I had prepared the script adjusted to point transects and limited
field of view from the first round. What is different about the data set I now
created, compared to the set I had received from 2020, is that distances are
only estimated to full meters, instead of continuous values before. I was
therefore now checking GoF with the Chi-Square, but I always end up with an
extremely low p value. In Howe et al. I read that in CT surveys the lack of
independence may impact the usual model selection criteria. May this be the
issue?
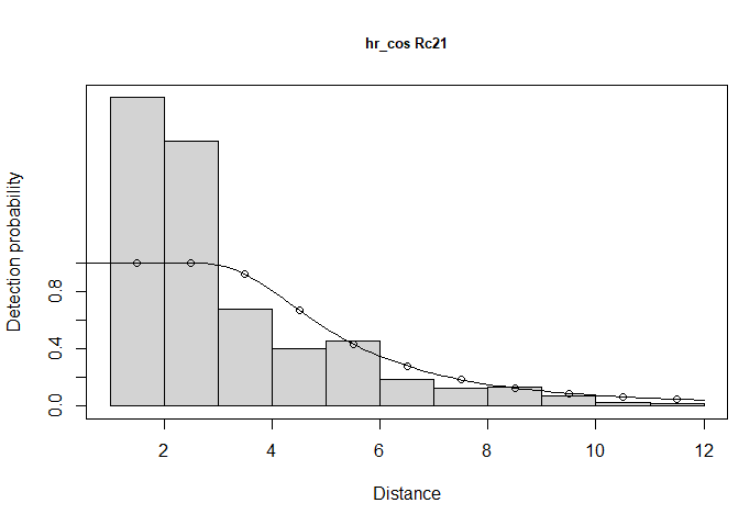
I am also a bit uncertain about the high peak and quick drop in detection
probability.
In the setup, there were markers placed in front of the cameras at 3,6 and 9
meters, which also distracted some of the animals, so I had many records at
those distances.
But this was also the same set up in 2020, so I am not sure why it appears more
prominent.
I am still able to produce density estimates with the dht2, as before and they appear reasonable at first sight, however I am unsure about this as long as the detection function doesn’t seem right.
I hope I explained my
thoughts reasonably well, I would be happy to add any more info if necessary.
Thank you very much, kind regards.
Carolin Klangwald

Eric Rexstad
- distances to the nearest meter
- as you note, the data should be binned, therefore chi-square goodness of fit tests are the only tests available
- poor goodness of fit
- as you note, this is caused by overdispersion or lack of independence of detections. Not only does overdispersion cause problems with model fit, but it also influences model selection, with a likelihood of fitting models that are too complex.
- remedy for model selection in the face of overdispersion is described in Howe et al. (2019)
- version 1.0.4 of the Distance package on CRAN has included functions for using QAIC as a model selection technique, the vignette at the link below contains similar functions to perform the QAIC calculations
- plots to visually assess model fit for point transect (camera trap) data should examine the probability density function (pdf), for example
plot(mymodel, pdf=TRUE)
Sent: 01 March 2022 12:43
To: distance-sampling <distance...@googlegroups.com>
Subject: {Suspected Spam} {Filename?} [distance-sampling] Camera Trap Data & GoF
You received this message because you are subscribed to the Google Groups "distance-sampling" group.
To unsubscribe from this group and stop receiving emails from it, send an email to distance-sampl...@googlegroups.com.
To view this discussion on the web visit https://groups.google.com/d/msgid/distance-sampling/3d1a2f8e-c258-4889-944b-21f903da48e1n%40googlegroups.com.

Stephen Buckland
> I am also a bit uncertain about the high peak and quick drop in detection probability.
> In the setup, there were markers placed in front of the cameras at 3,6 and 9 meters, which also distracted some of the animals, so I had many records at those distances.
> But this was also the same set up in 2020, so I am not sure why it appears more prominent.
It may not be animal behaviour, but due to how distances are estimated. The fitted detection function looks fine. You’re over-interpreting the histogram. There is a combination of rounding in the estimates plus overdispersion, which makes the histogram look slightly odd. If rounding is mostly to the nearest metre, you should not use a width of histogram bar that is less than one metre, and you should avoid using cutpoints that correspond to favoured rounding distances. Cutpoints of 0.0, 1.5, 2.5, 3.5 … would be better. You’ll probably want to make the cutpoints farther apart for larger distances, something like 0.0, 1.5, 2.5, 3.5, 4.5, 6.5, 8.5, 12.5. As Eric notes, the overdispersion invalidates the GoF tests.
Steve Buckland
Carolin Klangwald
I must admit I was a bit intimidated by the QAIC before, but with the new version of the package I think im getting the hang of it.
All the best,
Carolin Klangwald
Uni Potsdam