How to view component percentages of variance in R
158 views
Skip to first unread message

Evan Curtis
Oct 16, 2022, 9:11:43 PM10/16/22
to distance-sampling
Hi distancers,
I'm using R. I have an mrds model. I would like to view the component percentages of variance to determine which component contributes most to Dhat cv.
I don't recall the r code to view a nice neat output for this. So I tried using:
mymrdsmodel[["individuals"]][["vc"]]
mymrdsmodel[["individuals"]][["vc"]]
but I can't decipher the output. I'm sure there's a proper way to get this info.
Can anyone help me with the r code to call a nice neat table showing component percentages of variance?
Thanks in advance,
Evan
Evan
Evan Curtis
Oct 17, 2022, 7:23:00 PM10/17/22
to distance-sampling
Hi again,
Thought I'd add this for clarity... I wish to know the proportional contribution of both encounter rate and detection function variance to Dhat variance when density is estimated using mrds.
Thanks Evan
Thanks Evan

Eric Rexstad
Oct 18, 2022, 5:21:09 AM10/18/22
to distance-sampling, Evan Curtis
Evan
Good to hear from you. Your search for variance components is probably not going to be satisfied by going through the variance covariance information produced by
dht.
The code below takes a longer journey, but I think it produces what you want. It follows the calculations based around CVs as presented in our introductory distance sampling workshop lecture on precision (slide 32).
I've used an example data set provided with the
mrds package and ferreted the necessary bits of model output to compute the percentage of abundance estimate uncertainty associated with the detection function and encounter rate. Hope this is helpful.
library(mrds)
data(book.tee.data)
region <- book.tee.data$book.tee.region
egdata <- book.tee.data$book.tee.dataframe
samples <- book.tee.data$book.tee.samples
obs <- book.tee.data$book.tee.obs
# fit an independent observer model with full independence
result.io.fi <- ddf(mrmodel=~glm(~distance), data=egdata, method="io.fi",
meta.data=list(width = 4))
out <- dht(result.io.fi, region, samples, obs)
cv.er <- out$individuals$summary[3,"cv.ER"]
cv.p <- summary(result.io.fi)$average.p.se / summary(result.io.fi)$average.p
cv.N <- out$individuals$N[3, "cv"]
prop.p <- as.numeric(cv.p)^2 / cv.N^2 * 100
print(paste(round(prop.p,2), round(prop.er,2)))
sum(c(prop.er, prop.p))
From: 'Evan Curtis' via distance-sampling <distance...@googlegroups.com>
Sent: 18 October 2022 00:23
To: distance-sampling <distance...@googlegroups.com>
Subject: [distance-sampling] Re: How to view component percentages of variance in R
Sent: 18 October 2022 00:23
To: distance-sampling <distance...@googlegroups.com>
Subject: [distance-sampling] Re: How to view component percentages of variance in R
--
You received this message because you are subscribed to the Google Groups "distance-sampling" group.
To unsubscribe from this group and stop receiving emails from it, send an email to distance-sampl...@googlegroups.com.
To view this discussion on the web visit https://groups.google.com/d/msgid/distance-sampling/9bb38035-4e16-46a2-9ec7-b2c7b80562d7n%40googlegroups.com.
Evan Curtis
Oct 19, 2022, 8:28:09 PM10/19/22
to distance-sampling
Hi Eric,
Yes thankyou. That is (almost) what I was after - the Delta method. I can see how your code relates to the slides in precision lecture perfectly.
I'm still having some trouble making sense of this approach in relation to mrds. I believe there could be a problem because when I ran your code on the golftee data, although the logic makes sense, the final line (sum(c(prop.er, prop.p)) added to > 100. I was expecting it to sum to 100 or less than 100.
I suspect it may be related to summary(result.io.fi)$cv not being equal to out$individuals$N[3, "cv"]. I'm guessing that the Horvitz Thompson estimator in the dht call is playing a role?
I'm happy to accept that component percentage of variances cannot be compared for mrds estimates derived using the dht() function if that is the outcome here.
As always, thanks for investigating Eric.
As always, thanks for investigating Eric.
Cheers,
Evan
Evan
Eric Rexstad
Oct 20, 2022, 1:02:06 AM10/20/22
to distance-sampling, Evan Curtis
Evan
You're right that it is the delta method. Although the calculations are not exact, they give you a rough idea of what components contribute most substantially to uncertainty in your estimates (are the components contributing roughly equally, is encounter rate
a factor of 2X or 3X—that sort of understanding).
From: 'Evan Curtis' via distance-sampling <distance...@googlegroups.com>
Sent: 20 October 2022 01:28
To: distance-sampling <distance...@googlegroups.com>
Subject: Re: [distance-sampling] Re: How to view component percentages of variance in R
To: distance-sampling <distance...@googlegroups.com>
Subject: Re: [distance-sampling] Re: How to view component percentages of variance in R
To view this discussion on the web visit
https://groups.google.com/d/msgid/distance-sampling/3ec902ed-3c6d-481b-86df-438d91bed348n%40googlegroups.com.
Evan Curtis
Oct 20, 2022, 5:05:15 PM10/20/22
to distance-sampling
Aah I see. OK thankyou Eric!
Eric Rexstad
Oct 21, 2022, 6:17:46 AM10/21/22
to distance-sampling, Evan Curtis
Evan
For your information: the distance development group is reviewing the variance estimation methods inside our packages, with ripple effects associated with variance component analysis. That review is scheduled to be complete by the end of the year.
From: 'Evan Curtis' via distance-sampling <distance...@googlegroups.com>
Sent: 20 October 2022 22:05
To view this discussion on the web visit
https://groups.google.com/d/msgid/distance-sampling/a969e031-a8f7-45e8-99cb-b362a8997bc9n%40googlegroups.com.
From: 'Evan Curtis' via distance-sampling <distance...@googlegroups.com>
Sent: 20 October 2022 22:05
To view this discussion on the web visit
https://groups.google.com/d/msgid/distance-sampling/a969e031-a8f7-45e8-99cb-b362a8997bc9n%40googlegroups.com.
Message has been deleted
Evan Curtis
Oct 18, 2023, 10:16:27 PM10/18/23
to distance-sampling
Hi Eric,
Dht ninja here. Just reviewed this conversation from a year ago and checking whether there were any updates re variance component analysis?
I think I've managed to extract the component variances for CDS, MCDS and MRDS (likelihoods all estimated in dht()) using a pretty simple function that works for mentioned model types. In the example below, my dht() object is FG.roo.CDS.hn.dht
comvar.er <- function(a) {
ComVar.er <- ((a[["clusters"]][["vc"]][["er"]]/
a[["clusters"]][["vc"]][["total"]]) * 100)
return(ComVar.er)
}
ComVar.er <- ((a[["clusters"]][["vc"]][["er"]]/
a[["clusters"]][["vc"]][["total"]]) * 100)
return(ComVar.er)
}
comvar.er(FG.roo.CDS.hn.dht)
and
comvar.f0 <- function(a) {
ComVar.f0 <- ((a[["clusters"]][["vc"]][["detection"]][["variance"]]/
a[["clusters"]][["vc"]][["total"]]) * 100)
return(ComVar.f0)
}
comvar.f0(FG.roo.CDS.hn.dht)
ComVar.f0 <- ((a[["clusters"]][["vc"]][["detection"]][["variance"]]/
a[["clusters"]][["vc"]][["total"]]) * 100)
return(ComVar.f0)
}
comvar.f0(FG.roo.CDS.hn.dht)
I haven't used this approach before so was just after some validation / any suggestions for efficiency gains (I assume a call for this function is already written into the Distance package).
FYI the data is the same for each model (except MR has 2 observers) and I'm looking at how adding complexity affects bias and precision. The relative contribution of the detection function to total variance appears to be increasing as more complex models account for sources of variance like observer and aircraft speed. This is what I think is happening as the encounter rate doesn't change because the data is the same - unless the MR model affects encounter rate.
Cheers,
Evan
Evan
Evan Curtis
Oct 19, 2023, 1:22:37 AM10/19/23
to distance-sampling
The method I used in the previous comment appears to work when calculating manually using delta method (see table below). Density CV^2 = ER.CV^2 + DProb.CV^2
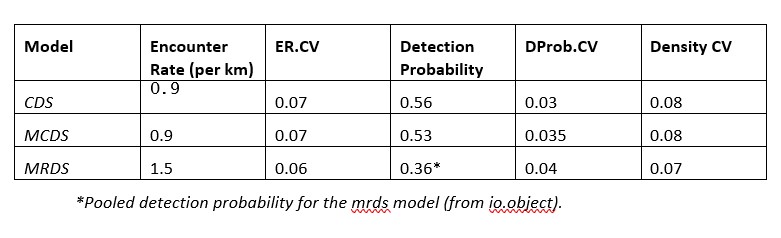
Cheers,
Evan
Evan
Reply all
Reply to author
Forward
0 new messages