detfct not working on models with adjustment terms
20 views
Skip to first unread message

Greg Forcey
Jan 10, 2023, 3:56:27 PM1/10/23
to distance-sampling
I'm attempting to predict detection probabilities at various distances from my data and the models from Distance. I know the predict function does not do this, but I saw in some posts from 2017 and 2018 where it was suggested to use detfct to accomplish this:
detfct(seq(0,250,50), model$ddf$ds$aux$ddfobj)
What I've noticed is that this only works if the model has no adjustment terms. if there are any adjustment terms, detfct just returns a blank numeric vector.
Is there any way to use models with adjustment terms to predict the detection probabilities at defined distances? With my data, models with adjustment terms are often a better fit than models without them. If not, then is the next best solution to use the adjustment = NULL when fitting the models with the ds function?
Thank you,
~Greg

Eric Rexstad
Jan 11, 2023, 3:41:53 AM1/11/23
to Greg Forcey, distance-sampling
Greg
I've had a look at
detfct and it has had some revisions in the last couple of years. I agree it does not produce what you want in its current state. Give me a couple of days to poke around with it and get back to you.From: distance...@googlegroups.com <distance...@googlegroups.com> on behalf of Greg Forcey <gregf...@gmail.com>
Sent: 10 January 2023 20:56
To: distance-sampling <distance...@googlegroups.com>
Subject: [distance-sampling] detfct not working on models with adjustment terms
Sent: 10 January 2023 20:56
To: distance-sampling <distance...@googlegroups.com>
Subject: [distance-sampling] detfct not working on models with adjustment terms
--
You received this message because you are subscribed to the Google Groups "distance-sampling" group.
To unsubscribe from this group and stop receiving emails from it, send an email to distance-sampl...@googlegroups.com.
To view this discussion on the web visit https://groups.google.com/d/msgid/distance-sampling/015e35ca-56cd-4ccc-b6df-a93fe0d286b1n%40googlegroups.com.
Eric Rexstad
Jan 11, 2023, 5:58:29 AM1/11/23
to Greg Forcey, distance-sampling
Greg
I've got a partial solution for you. The
detfct function gets used in the iterative model fitting process, so it is a workhorse. It expects to work with the actual data, hence I've not made it behave when I send a set of perpendicular distances that are not equivalent to the observed
distances.However, if I send the function a vector of distances from my data, I get success, regardless
of the presence of adjustment terms. The secret in the presence of adjustment terms is to also include the
width= argument to detfct. Here are examples using the ducknest data shipped with the Distance package.library(Distance)
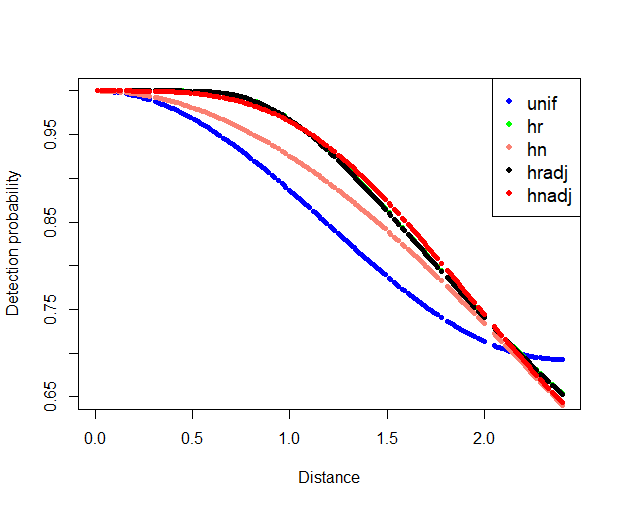
data("ducknest")
unif <- ds(ducknest, key="unif")
hr <- ds(ducknest, key="hr")
hn <- ds(ducknest, key="hn")
hnadj <- ds(ducknest, key="hn", adjustment = "cos", nadj = 1)
hradj <- ds(ducknest, key="hr", adjustment = "cos", nadj = 1)
unif.detfct <- detfct(ducknest$distance, unif$ddf$ds$aux$ddfobj, width=2.4)
hr.detfct <- detfct(ducknest$distance, hr$ddf$ds$aux$ddfobj, width=2.4)
hradj.detfct <- detfct(ducknest$distance, hradj$ddf$ds$aux$ddfobj, width=2.4)
hn.detfct <- detfct(ducknest$distance, hn$ddf$ds$aux$ddfobj, width=2.4)
hnadj.detfct <- detfct(ducknest$distance, hnadj$ddf$ds$aux$ddfobj, width=2.4)
plot(ducknest$distance, unif.detfct, ylim=c(0.65,1), col="blue", pch=20,
xlab="Distance", ylab="Detection probability")
points(ducknest$distance, hr.detfct, col="green", pch=20)
points(ducknest$distance, hn.detfct, col="salmon", pch=20)
points(ducknest$distance, hradj.detfct, col="black", pch=20)
points(ducknest$distance, hnadj.detfct, col="red", pch=20)
legend("topright", legend=c("unif", "hr", "hn", "hradj", "hnadj"),
col = c("blue", "green", "salmon", "black", "red"), pch=20, cex=1.2)
Hope that's useful for you.
From: distance...@googlegroups.com <distance...@googlegroups.com> on behalf of Greg Forcey <gregf...@gmail.com>
Sent: 10 January 2023 20:56
To: distance-sampling <distance...@googlegroups.com>
Subject: [distance-sampling] detfct not working on models with adjustment terms
Sent: 10 January 2023 20:56
To: distance-sampling <distance...@googlegroups.com>
Subject: [distance-sampling] detfct not working on models with adjustment terms
--
Greg Forcey
Jan 11, 2023, 5:07:15 PM1/11/23
to distance-sampling
Eric, this seems to work. Thank you very much.
Reply all
Reply to author
Forward
0 new messages