label contours
13 views
Skip to first unread message

Shahid Maqbool
Oct 31, 2022, 2:13:59 AM10/31/22
to dislin-users
Dear all,
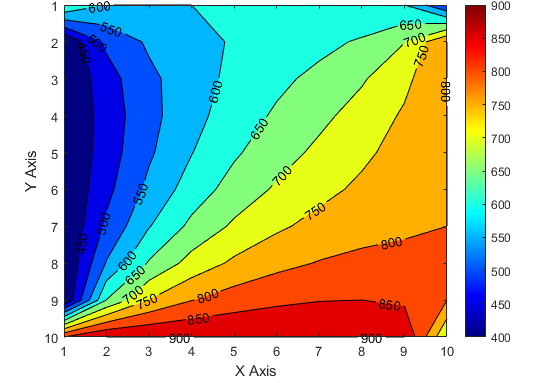
I have the output matrix whose plot looks like (matlab plot).

Helmut Michels
Oct 31, 2022, 11:01:22 AM10/31/22
to dislin-users
Dear Shadid,
for getting a similar result as in your Matlab plot, you have to call 'conshd' for
plotting the shaded areas between contour lines and 'contur' for drawing the
labeled contour lines. conshd expects an array of contour levels, while contur must
be called for each single value in the level array. For example:
real zlvray(n), xray(nx), yray(ny), zmat(nx,ny)
...
call conshd (xray, nx, yray, ny, zmat, zlvray, n)
call labels ('FLOAT', 'CONTUR')
do i=1,n
call contur (xray, nx, yray, ny, zmat, zlvray(i))
end do
...
With best regards,
Helmut
Shahid Maqbool
Nov 1, 2022, 8:43:56 AM11/1/22
to dislin-users
Dear Helmut,
thanks. It is working now.
Best regards
Shahid
Reply all
Reply to author
Forward
0 new messages