Plot a contour 2-D mesh interpolating the values of the nodes
36 views
Skip to first unread message


Helmut Michels
May 25, 2022, 10:34:38 AM5/25/22
to dislin-users
Hi Toni,
yes, this is possible. For example, the Dislin routine CRVTRI plots coloured triangles. Colour
interpolation of the nodes will be done if the option SHDMOD ('SMOOTH', 'SURFACE') is used
before. Mesh lines around the triangles can be enabled with the option SURMSH ('ON').
With best regards,
Helmut
Toni Barredo Juan
May 29, 2022, 6:22:05 PM5/29/22
to dislin-users
Hi Helmut,
Thank you for your answer. I got the plot I wanted.
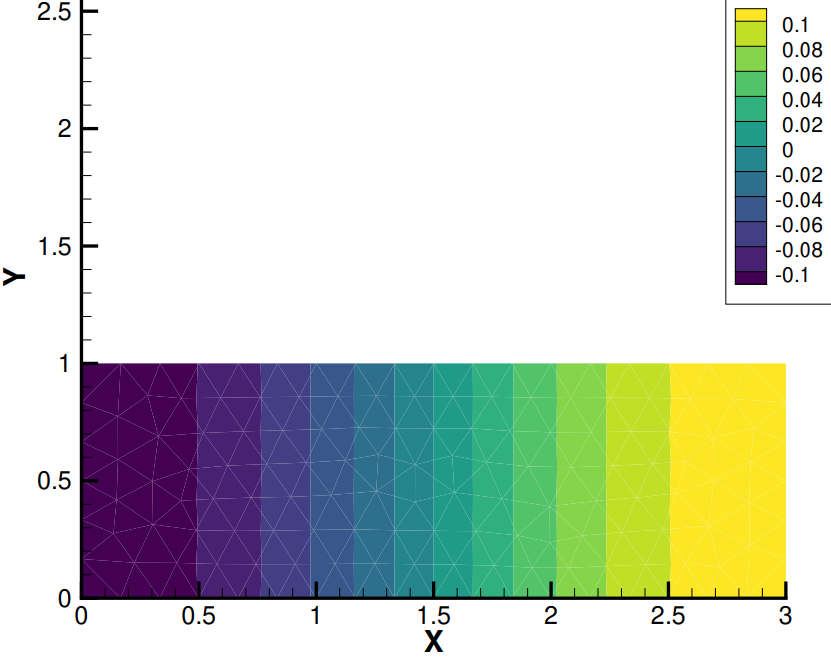
I was wondering if it is possible to plot contour lines as in the example_1, segmenting the gradient bar in N colors rather than a smooth one.
Moreover, I am developing a GUI on Qt. Does it exist any compatibility DISLIN-Qt?
Best regards,
Toni
Helmut Michels
May 30, 2022, 1:16:16 PM5/30/22
to dislin-users
Hi Toni,
I think that you can plot the triangle mesh with the routine CRVTRI after the option SURMSH ('ONLY')
and then plot the filled contours with the routine CONTRI above the mesh.
No, there is no compatibility between the Dislin widget routines and Qt. The Dislin widgets are based
on OpenMotif for X11 systems and on GDI for Windows, but it's possible to send the graphical output
of Dislin to an external window. You can take a look at the Dislin routine SETXID.
With best regards,
Helmut
Reply all
Reply to author
Forward
0 new messages