Dim_STAT tools can not collect InnoDB data
50 views
Skip to first unread message

coffeer...@gmail.com
Apr 8, 2016, 1:30:11 AM4/8/16
to dim_STAT
Hello everyone! Dim_STAT tools can not collect InnoDB MySQL related data, the steps used are as follows:
1、/bin/sh innodbMETRICS.sh
2、/bin/sh innodbMUTEX.sh
3、/bin/sh innodbSTAT.sh
[root@docker-pre-5-31 bin]# sh innodbSTAT.sh 2
STAT-name STAT-value
db-server-online 0
STAT-name STAT-value
db-server-online 0
STAT-name STAT-value
db-server-online 0
[root@docker-pre-5-31 bin]# sh innodbMETRICS.sh 2
STAT-name STAT-value
db-server-online 1
STAT-name STAT-value
db-server-online 1
STAT-name STAT-value
db-server-online 1
I would like to ask what to do to collect InnoDB data can be adjusted.

Dimitri
Apr 8, 2016, 4:38:10 AM4/8/16
to dim...@googlegroups.com
Hi,
I suppose you're mentioning STAT-service here that you deployed on
Docker and willing to collect InnoDB stats.. -- hope you deployed the
latest tarball (rev.5.3)
supposing it's deployed in /apps/STATsrv directory :
- you'll fine a .env-mysql file which is here to simplify your MySQL
connection config
- edit this file to set the Host IP address, IP port, user name and password
- (NOTE: for "localhost" rather use 127.0.0.1 address)
- once you're done, try :
$ /apps/mysqlLOAD.sh 5
and see if it's showing some numbers from your MySQL server or not.
NOTE: most of MySQL stats scripts in STAT-service are printing the
"db-server-online" (or "OnLine") line/column containing 1 or 0 => this
is just to show you if the script was able to connect to your database
or not (so, for the script then it means that your MySQL server is
online or not)..
from your innodbSTAT.sh output it's seen that the script is unable to
connect to your MySQL server..
from innodbMETRICS.sh - seems like the script is connecting, but has
nothing to print.. -- are you sure InnoDB metrics stats are enabled on
your MySQL config ??.. => check you have the following in your my.conf
:
innodb_monitor_enable = '%'
so, please, recheck all these points again and let me know what is
working and what is not for you..
Rgds,
-Dimitri
> --
> You received this message because you are subscribed to the Google Groups
> "dim_STAT" group.
> To unsubscribe from this group and stop receiving emails from it, send an
> email to dimstat+u...@googlegroups.com.
> To post to this group, send email to dim...@googlegroups.com.
> Visit this group at https://groups.google.com/group/dimstat.
> For more options, visit https://groups.google.com/d/optout.
>
I suppose you're mentioning STAT-service here that you deployed on
Docker and willing to collect InnoDB stats.. -- hope you deployed the
latest tarball (rev.5.3)
supposing it's deployed in /apps/STATsrv directory :
- you'll fine a .env-mysql file which is here to simplify your MySQL
connection config
- edit this file to set the Host IP address, IP port, user name and password
- (NOTE: for "localhost" rather use 127.0.0.1 address)
- once you're done, try :
$ /apps/mysqlLOAD.sh 5
and see if it's showing some numbers from your MySQL server or not.
NOTE: most of MySQL stats scripts in STAT-service are printing the
"db-server-online" (or "OnLine") line/column containing 1 or 0 => this
is just to show you if the script was able to connect to your database
or not (so, for the script then it means that your MySQL server is
online or not)..
from your innodbSTAT.sh output it's seen that the script is unable to
connect to your MySQL server..
from innodbMETRICS.sh - seems like the script is connecting, but has
nothing to print.. -- are you sure InnoDB metrics stats are enabled on
your MySQL config ??.. => check you have the following in your my.conf
:
innodb_monitor_enable = '%'
so, please, recheck all these points again and let me know what is
working and what is not for you..
Rgds,
-Dimitri
> You received this message because you are subscribed to the Google Groups
> "dim_STAT" group.
> To unsubscribe from this group and stop receiving emails from it, send an
> email to dimstat+u...@googlegroups.com.
> To post to this group, send email to dim...@googlegroups.com.
> Visit this group at https://groups.google.com/group/dimstat.
> For more options, visit https://groups.google.com/d/optout.
>
coffeer...@gmail.com
Apr 9, 2016, 4:26:58 AM4/9/16
to dim_STAT
Thank you very much for your help, the following is the deployment of information !
========================================
dim_STAT:
|--IP:192.168.23.190
|--DeployPATH:/apps/
|--ADMIN/
|--client/
|--htmldoc/
|--httpd/
|--Java2GIF/
|--mysql/
=========================================
STATsrv:
|--IP:192.168.23.190
|--DeployPATH:/opt/pkg/tmp/STATsrv/
|--bin/
|--...
=========================================
MySQL:
|--IP:192.168.23.48
=========================================
my.cnf(just innodb):
### InnoDB
innodb_data_home_dir = /data/mysql/innodb
innodb_data_file_path = ibdata1:1000M;ibdata2:1000M;
innodb_log_group_home_dir = /data/mysql/innodb_log
innodb_log_files_in_group = 3
innodb_log_file_size = 256M
innodb_log_buffer_size = 8M
innodb_buffer_pool_size = 4G
innodb_buffer_pool_filename=ib_buffer_pool
innodb_buffer_pool_instances = 8
innodb_additional_mem_pool_size = 2M
innodb_file_per_table = 1
innodb_thread_concurrency = 0
innodb_concurrency_tickets = 5000
innodb_open_files = 65536
innodb_flush_log_at_trx_commit = 2
innodb_file_io_threads = 4
innodb_read_io_threads = 64
innodb_write_io_threads = 64
innodb_io_capacity = 200
innodb_locks_unsafe_for_binlog = 1
innodb_autoinc_lock_mode = 2
innodb_autoextend_increment = 64M
innodb_purge_threads = 1
innodb_max_dirty_pages_pct = 75
innodb_thread_sleep_delay = 10
innodb_locks_unsafe_for_binlog = 1
innodb_lock_wait_timeout = 50
innodb_buffer_pool_dump_at_shutdown = ON
innodb_buffer_pool_load_at_startup = ON
innodb_monitor_enable = '%'
=========================================
Collect Data stream:
STATsrv(192.168.23.190)--->MySQL(192.168.23.48)
=========================================
.env-mysql
User=dim
Passwd=dim
Host=192.168.23.48:3306
export User Passwd Host
=========================================
Now All MySQL based data can be collected, but the InnoDB data still can not be collected.
Dimitri
Apr 9, 2016, 6:05:55 AM4/9/16
to dim...@googlegroups.com
Ok, so other MySQL stats are working, but not InnoDB..
What is the output of :
$ echo "show engine innodb status\G" | mysql -udim -pdim -h 192.168.23.48 -P 3306
Rgds,
-Dimitri
coffeer...@gmail.com
Apr 10, 2016, 8:54:56 PM4/10/16
to dim_STAT
Really thank you very much, you have helped me a lot. Now most of the InnoDB data acquisition problem has been solved.
Currently available to collect InnoDB data script is as follows:
1, innodbCMP.sh
2, innodbMETRICS.sh
3, innodbMUTEX.sh
Currently still can not collect InnoDB data script is as follows:
1, innodbSTAT.sh
All environment variable files that are read by the script are.Env-mysql.
Database account [dim] permissions:
1, SELECT
2, INSERT
3, UPDATE
4, DELETE
5, PROCESS
It is very strange that the output information of the script innodbSTAT.sh is as follows:
Db-server-online 0
But the fact that the database can be connected, this I can be sure.
To unsubscribe from this group and stop receiving emails from it, send an email to dimstat+unsubscribe@googlegroups.com.
Dimitri
Apr 11, 2016, 2:04:48 AM4/11/16
to dim...@googlegroups.com
Hi,
the innodbSTAT script is little bit different from others : if it will see some key data missed from the "innodb status" output -- it'll consider the output corrupted due server shutdown, etc. -- and not consider your server as online..
That's why I'm asking you for the output of
coffeer...@gmail.com
Apr 11, 2016, 8:15:49 PM4/11/16
to dim_STAT
I am very sorry to forget to display status InnoDB information, and now immediately show.
MySQL Version:MariaDB-10.0.17
[root@localhost ~]# echo "show engine innodb status\G" | mysql -udim -pdim -h 192.168.23.48 -P 3306
*************************** 1. row ***************************
Type: InnoDB
Name:
Status:
=====================================
2016-04-12 08:10:45 7efd67bf4700 INNODB MONITOR OUTPUT
=====================================
Per second averages calculated from the last 54 seconds
-----------------
BACKGROUND THREAD
-----------------
srv_master_thread loops: 1 srv_active, 0 srv_shutdown, 83474 srv_idle
srv_master_thread log flush and writes: 83475
----------
SEMAPHORES
----------
OS WAIT ARRAY INFO: reservation count 3
OS WAIT ARRAY INFO: signal count 3
Mutex spin waits 4, rounds 32, OS waits 1
RW-shared spins 2, rounds 60, OS waits 2
RW-excl spins 0, rounds 0, OS waits 0
Spin rounds per wait: 8.00 mutex, 30.00 RW-shared, 0.00 RW-excl
------------
TRANSACTIONS
------------
Trx id counter 14787588
Purge done for trx's n:o < 14786099 undo n:o < 0 state: running but idle
History list length 192
LIST OF TRANSACTIONS FOR EACH SESSION:
---TRANSACTION 0, not started
MySQL thread id 35, OS thread handle 0x7efd67bf4700, query id 123 192.168.23.48 dim init
show engine innodb status
---TRANSACTION 14787587, not started
MySQL thread id 1, OS thread handle 0x7efd5f1fe700, query id 0 Waiting for background binlog tasks
--------
FILE I/O
--------
I/O thread 0 state: waiting for completed aio requests (insert buffer thread)
I/O thread 1 state: waiting for completed aio requests (log thread)
I/O thread 2 state: waiting for completed aio requests (read thread)
I/O thread 3 state: waiting for completed aio requests (read thread)
I/O thread 4 state: waiting for completed aio requests (read thread)
I/O thread 5 state: waiting for completed aio requests (read thread)
I/O thread 6 state: waiting for completed aio requests (read thread)
I/O thread 7 state: waiting for completed aio requests (read thread)
I/O thread 8 state: waiting for completed aio requests (read thread)
I/O thread 9 state: waiting for completed aio requests (read thread)
I/O thread 10 state: waiting for completed aio requests (read thread)
I/O thread 11 state: waiting for completed aio requests (read thread)
I/O thread 12 state: waiting for completed aio requests (read thread)
I/O thread 13 state: waiting for completed aio requests (read thread)
I/O thread 14 state: waiting for completed aio requests (read thread)
I/O thread 15 state: waiting for completed aio requests (read thread)
I/O thread 16 state: waiting for completed aio requests (read thread)
I/O thread 17 state: waiting for completed aio requests (read thread)
I/O thread 18 state: waiting for completed aio requests (read thread)
I/O thread 19 state: waiting for completed aio requests (read thread)
I/O thread 20 state: waiting for completed aio requests (read thread)
I/O thread 21 state: waiting for completed aio requests (read thread)
I/O thread 22 state: waiting for completed aio requests (read thread)
I/O thread 23 state: waiting for completed aio requests (read thread)
I/O thread 24 state: waiting for completed aio requests (read thread)
I/O thread 25 state: waiting for completed aio requests (read thread)
I/O thread 26 state: waiting for completed aio requests (read thread)
I/O thread 27 state: waiting for completed aio requests (read thread)
I/O thread 28 state: waiting for completed aio requests (read thread)
I/O thread 29 state: waiting for completed aio requests (read thread)
I/O thread 30 state: waiting for completed aio requests (read thread)
I/O thread 31 state: waiting for completed aio requests (read thread)
I/O thread 32 state: waiting for completed aio requests (read thread)
I/O thread 33 state: waiting for completed aio requests (read thread)
I/O thread 34 state: waiting for completed aio requests (read thread)
I/O thread 35 state: waiting for completed aio requests (read thread)
I/O thread 36 state: waiting for completed aio requests (read thread)
I/O thread 37 state: waiting for completed aio requests (read thread)
I/O thread 38 state: waiting for completed aio requests (read thread)
I/O thread 39 state: waiting for completed aio requests (read thread)
I/O thread 40 state: waiting for completed aio requests (read thread)
I/O thread 41 state: waiting for completed aio requests (read thread)
I/O thread 42 state: waiting for completed aio requests (read thread)
I/O thread 43 state: waiting for completed aio requests (read thread)
I/O thread 44 state: waiting for completed aio requests (read thread)
I/O thread 45 state: waiting for completed aio requests (read thread)
I/O thread 46 state: waiting for completed aio requests (read thread)
I/O thread 47 state: waiting for completed aio requests (read thread)
I/O thread 48 state: waiting for completed aio requests (read thread)
I/O thread 49 state: waiting for completed aio requests (read thread)
I/O thread 50 state: waiting for completed aio requests (read thread)
I/O thread 51 state: waiting for completed aio requests (read thread)
I/O thread 52 state: waiting for completed aio requests (read thread)
I/O thread 53 state: waiting for completed aio requests (read thread)
I/O thread 54 state: waiting for completed aio requests (read thread)
I/O thread 55 state: waiting for completed aio requests (read thread)
I/O thread 56 state: waiting for completed aio requests (read thread)
I/O thread 57 state: waiting for completed aio requests (read thread)
I/O thread 58 state: waiting for completed aio requests (read thread)
I/O thread 59 state: waiting for completed aio requests (read thread)
I/O thread 60 state: waiting for completed aio requests (read thread)
I/O thread 61 state: waiting for completed aio requests (read thread)
I/O thread 62 state: waiting for completed aio requests (read thread)
I/O thread 63 state: waiting for completed aio requests (read thread)
I/O thread 64 state: waiting for completed aio requests (read thread)
I/O thread 65 state: waiting for completed aio requests (read thread)
I/O thread 66 state: waiting for completed aio requests (write thread)
I/O thread 67 state: waiting for completed aio requests (write thread)
I/O thread 68 state: waiting for completed aio requests (write thread)
I/O thread 69 state: waiting for completed aio requests (write thread)
I/O thread 70 state: waiting for completed aio requests (write thread)
I/O thread 71 state: waiting for completed aio requests (write thread)
I/O thread 72 state: waiting for completed aio requests (write thread)
I/O thread 73 state: waiting for completed aio requests (write thread)
I/O thread 74 state: waiting for completed aio requests (write thread)
I/O thread 75 state: waiting for completed aio requests (write thread)
I/O thread 76 state: waiting for completed aio requests (write thread)
I/O thread 77 state: waiting for completed aio requests (write thread)
I/O thread 78 state: waiting for completed aio requests (write thread)
I/O thread 79 state: waiting for completed aio requests (write thread)
I/O thread 80 state: waiting for completed aio requests (write thread)
I/O thread 81 state: waiting for completed aio requests (write thread)
I/O thread 82 state: waiting for completed aio requests (write thread)
I/O thread 83 state: waiting for completed aio requests (write thread)
I/O thread 84 state: waiting for completed aio requests (write thread)
I/O thread 85 state: waiting for completed aio requests (write thread)
I/O thread 86 state: waiting for completed aio requests (write thread)
I/O thread 87 state: waiting for completed aio requests (write thread)
I/O thread 88 state: waiting for completed aio requests (write thread)
I/O thread 89 state: waiting for completed aio requests (write thread)
I/O thread 90 state: waiting for completed aio requests (write thread)
I/O thread 91 state: waiting for completed aio requests (write thread)
I/O thread 92 state: waiting for completed aio requests (write thread)
I/O thread 93 state: waiting for completed aio requests (write thread)
I/O thread 94 state: waiting for completed aio requests (write thread)
I/O thread 95 state: waiting for completed aio requests (write thread)
I/O thread 96 state: waiting for completed aio requests (write thread)
I/O thread 97 state: waiting for completed aio requests (write thread)
I/O thread 98 state: waiting for completed aio requests (write thread)
I/O thread 99 state: waiting for completed aio requests (write thread)
I/O thread 100 state: waiting for completed aio requests (write thread)
I/O thread 101 state: waiting for completed aio requests (write thread)
I/O thread 102 state: waiting for completed aio requests (write thread)
I/O thread 103 state: waiting for completed aio requests (write thread)
I/O thread 104 state: waiting for completed aio requests (write thread)
I/O thread 105 state: waiting for completed aio requests (write thread)
I/O thread 106 state: waiting for completed aio requests (write thread)
I/O thread 107 state: waiting for completed aio requests (write thread)
I/O thread 108 state: waiting for completed aio requests (write thread)
I/O thread 109 state: waiting for completed aio requests (write thread)
I/O thread 110 state: waiting for completed aio requests (write thread)
I/O thread 111 state: waiting for completed aio requests (write thread)
I/O thread 112 state: waiting for completed aio requests (write thread)
I/O thread 113 state: waiting for completed aio requests (write thread)
I/O thread 114 state: waiting for completed aio requests (write thread)
I/O thread 115 state: waiting for completed aio requests (write thread)
I/O thread 116 state: waiting for completed aio requests (write thread)
I/O thread 117 state: waiting for completed aio requests (write thread)
I/O thread 118 state: waiting for completed aio requests (write thread)
I/O thread 119 state: waiting for completed aio requests (write thread)
I/O thread 120 state: waiting for completed aio requests (write thread)
I/O thread 121 state: waiting for completed aio requests (write thread)
I/O thread 122 state: waiting for completed aio requests (write thread)
I/O thread 123 state: waiting for completed aio requests (write thread)
I/O thread 124 state: waiting for completed aio requests (write thread)
I/O thread 125 state: waiting for completed aio requests (write thread)
I/O thread 126 state: waiting for completed aio requests (write thread)
I/O thread 127 state: waiting for completed aio requests (write thread)
I/O thread 128 state: waiting for completed aio requests (write thread)
I/O thread 129 state: waiting for completed aio requests (write thread)
Pending normal aio reads: 0 [0, 0, 0, 0, 0, 0, 0, 0, 0, 0, 0, 0, 0, 0, 0, 0, 0, 0, 0, 0, 0, 0, 0, 0, 0, 0, 0, 0, 0, 0, 0, 0, 0, 0, 0, 0, 0, 0, 0, 0, 0, 0, 0, 0, 0, 0, 0, 0, 0, 0, 0, 0, 0, 0, 0, 0, 0, 0, 0, 0, 0, 0, 0, 0] , aio writes: 0 [0, 0, 0, 0, 0, 0, 0, 0, 0, 0, 0, 0, 0, 0, 0, 0, 0, 0, 0, 0, 0, 0, 0, 0, 0, 0, 0, 0, 0, 0, 0, 0, 0, 0, 0, 0, 0, 0, 0, 0, 0, 0, 0, 0, 0, 0, 0, 0, 0, 0, 0, 0, 0, 0, 0, 0, 0, 0, 0, 0, 0, 0, 0, 0] ,
ibuf aio reads: 0, log i/o's: 0, sync i/o's: 0
Pending flushes (fsync) log: 0; buffer pool: 0
104152 OS file reads, 5 OS file writes, 5 OS fsyncs
0.00 reads/s, 0 avg bytes/read, 0.00 writes/s, 0.00 fsyncs/s
-------------------------------------
INSERT BUFFER AND ADAPTIVE HASH INDEX
-------------------------------------
Ibuf: size 1, free list len 155, seg size 157, 0 merges
merged operations:
insert 0, delete mark 0, delete 0
discarded operations:
insert 0, delete mark 0, delete 0
0.00 hash searches/s, 0.00 non-hash searches/s
---
LOG
---
Log sequence number 121953146905
Log flushed up to 121953146905
Pages flushed up to 121953146905
Last checkpoint at 121953146905
Max checkpoint age 651585393
Checkpoint age target 631223350
Modified age 0
Checkpoint age 0
0 pending log writes, 0 pending chkp writes
8 log i/o's done, 0.00 log i/o's/second
----------------------
BUFFER POOL AND MEMORY
----------------------
Total memory allocated 4395630592; in additional pool allocated 0
Total memory allocated by read views 88
Internal hash tables (constant factor + variable factor)
Adaptive hash index 75711776 (75691192 + 20584)
Page hash 553976 (buffer pool 0 only)
Dictionary cache 17760640 (17702096 + 58544)
File system 874288 (812272 + 62016)
Lock system 10626424 (10625704 + 720)
Recovery system 0 (0 + 0)
Dictionary memory allocated 58544
Buffer pool size 262136
Buffer pool size, bytes 4294836224
Free buffers 158089
Database pages 104046
Old database pages 38564
Modified db pages 0
Percent of dirty pages(LRU & free pages): 0.000
Max dirty pages percent: 75.000
Pending reads 0
Pending writes: LRU 0, flush list 0, single page 0
Pages made young 0, not young 0
0.00 youngs/s, 0.00 non-youngs/s
Pages read 104046, created 0, written 1
0.00 reads/s, 0.00 creates/s, 0.00 writes/s
No buffer pool page gets since the last printout
Pages read ahead 0.00/s, evicted without access 0.00/s, Random read ahead 0.00/s
LRU len: 104046, unzip_LRU len: 0
I/O sum[0]:cur[0], unzip sum[0]:cur[0]
----------------------
INDIVIDUAL BUFFER POOL INFO
----------------------
---BUFFER POOL 0
Buffer pool size 32767
Buffer pool size, bytes 536854528
Free buffers 19701
Database pages 13065
Old database pages 4842
Modified db pages 0
Percent of dirty pages(LRU & free pages): 0.000
Max dirty pages percent: 75.000
Pending reads 0
Pending writes: LRU 0, flush list 0, single page 0
Pages made young 0, not young 0
0.00 youngs/s, 0.00 non-youngs/s
Pages read 13065, created 0, written 1
0.00 reads/s, 0.00 creates/s, 0.00 writes/s
No buffer pool page gets since the last printout
Pages read ahead 0.00/s, evicted without access 0.00/s, Random read ahead 0.00/s
LRU len: 13065, unzip_LRU len: 0
I/O sum[0]:cur[0], unzip sum[0]:cur[0]
---BUFFER POOL 1
Buffer pool size 32767
Buffer pool size, bytes 536854528
Free buffers 19739
Database pages 13028
Old database pages 4829
Modified db pages 0
Percent of dirty pages(LRU & free pages): 0.000
Max dirty pages percent: 75.000
Pending reads 0
Pending writes: LRU 0, flush list 0, single page 0
Pages made young 0, not young 0
0.00 youngs/s, 0.00 non-youngs/s
Pages read 13028, created 0, written 0
0.00 reads/s, 0.00 creates/s, 0.00 writes/s
No buffer pool page gets since the last printout
Pages read ahead 0.00/s, evicted without access 0.00/s, Random read ahead 0.00/s
LRU len: 13028, unzip_LRU len: 0
I/O sum[0]:cur[0], unzip sum[0]:cur[0]
---BUFFER POOL 2
Buffer pool size 32767
Buffer pool size, bytes 536854528
Free buffers 19933
Database pages 12834
Old database pages 4757
Modified db pages 0
Percent of dirty pages(LRU & free pages): 0.000
Max dirty pages percent: 75.000
Pending reads 0
Pending writes: LRU 0, flush list 0, single page 0
Pages made young 0, not young 0
0.00 youngs/s, 0.00 non-youngs/s
Pages read 12834, created 0, written 0
0.00 reads/s, 0.00 creates/s, 0.00 writes/s
No buffer pool page gets since the last printout
Pages read ahead 0.00/s, evicted without access 0.00/s, Random read ahead 0.00/s
LRU len: 12834, unzip_LRU len: 0
I/O sum[0]:cur[0], unzip sum[0]:cur[0]
---BUFFER POOL 3
Buffer pool size 32767
Buffer pool size, bytes 536854528
Free buffers 19735
Database pages 13032
Old database pages 4830
Modified db pages 0
Percent of dirty pages(LRU & free pages): 0.000
Max dirty pages percent: 75.000
Pending reads 0
Pending writes: LRU 0, flush list 0, single page 0
Pages made young 0, not young 0
0.00 youngs/s, 0.00 non-youngs/s
Pages read 13032, created 0, written 0
0.00 reads/s, 0.00 creates/s, 0.00 writes/s
No buffer pool page gets since the last printout
Pages read ahead 0.00/s, evicted without access 0.00/s, Random read ahead 0.00/s
LRU len: 13032, unzip_LRU len: 0
I/O sum[0]:cur[0], unzip sum[0]:cur[0]
---BUFFER POOL 4
Buffer pool size 32767
Buffer pool size, bytes 536854528
Free buffers 19785
Database pages 12982
Old database pages 4812
Modified db pages 0
Percent of dirty pages(LRU & free pages): 0.000
Max dirty pages percent: 75.000
Pending reads 0
Pending writes: LRU 0, flush list 0, single page 0
Pages made young 0, not young 0
0.00 youngs/s, 0.00 non-youngs/s
Pages read 12982, created 0, written 0
0.00 reads/s, 0.00 creates/s, 0.00 writes/s
No buffer pool page gets since the last printout
Pages read ahead 0.00/s, evicted without access 0.00/s, Random read ahead 0.00/s
LRU len: 12982, unzip_LRU len: 0
I/O sum[0]:cur[0], unzip sum[0]:cur[0]
---BUFFER POOL 5
Buffer pool size 32767
Buffer pool size, bytes 536854528
Free buffers 19761
Database pages 13006
Old database pages 4821
Modified db pages 0
Percent of dirty pages(LRU & free pages): 0.000
Max dirty pages percent: 75.000
Pending reads 0
Pending writes: LRU 0, flush list 0, single page 0
Pages made young 0, not young 0
0.00 youngs/s, 0.00 non-youngs/s
Pages read 13006, created 0, written 0
0.00 reads/s, 0.00 creates/s, 0.00 writes/s
No buffer pool page gets since the last printout
Pages read ahead 0.00/s, evicted without access 0.00/s, Random read ahead 0.00/s
LRU len: 13006, unzip_LRU len: 0
I/O sum[0]:cur[0], unzip sum[0]:cur[0]
---BUFFER POOL 6
Buffer pool size 32767
Buffer pool size, bytes 536854528
Free buffers 19716
Database pages 13051
Old database pages 4837
Modified db pages 0
Percent of dirty pages(LRU & free pages): 0.000
Max dirty pages percent: 75.000
Pending reads 0
Pending writes: LRU 0, flush list 0, single page 0
Pages made young 0, not young 0
0.00 youngs/s, 0.00 non-youngs/s
Pages read 13051, created 0, written 0
0.00 reads/s, 0.00 creates/s, 0.00 writes/s
No buffer pool page gets since the last printout
Pages read ahead 0.00/s, evicted without access 0.00/s, Random read ahead 0.00/s
LRU len: 13051, unzip_LRU len: 0
I/O sum[0]:cur[0], unzip sum[0]:cur[0]
---BUFFER POOL 7
Buffer pool size 32767
Buffer pool size, bytes 536854528
Free buffers 19719
Database pages 13048
Old database pages 4836
Modified db pages 0
Percent of dirty pages(LRU & free pages): 0.000
Max dirty pages percent: 75.000
Pending reads 0
Pending writes: LRU 0, flush list 0, single page 0
Pages made young 0, not young 0
0.00 youngs/s, 0.00 non-youngs/s
Pages read 13048, created 0, written 0
0.00 reads/s, 0.00 creates/s, 0.00 writes/s
No buffer pool page gets since the last printout
Pages read ahead 0.00/s, evicted without access 0.00/s, Random read ahead 0.00/s
LRU len: 13048, unzip_LRU len: 0
I/O sum[0]:cur[0], unzip sum[0]:cur[0]
--------------
ROW OPERATIONS
--------------
0 queries inside InnoDB, 0 queries in queue
0 read views open inside InnoDB
0 RW transactions active inside InnoDB
0 RO transactions active inside InnoDB
0 out of 1000 descriptors used
Main thread process no. 13271, id 139626895353600, state: sleeping
Number of rows inserted 0, updated 0, deleted 0, read 3
0.00 inserts/s, 0.00 updates/s, 0.00 deletes/s, 0.00 reads/s
Number of system rows inserted 0, updated 0, deleted 0, read 1
0.00 inserts/s, 0.00 updates/s, 0.00 deletes/s, 0.00 reads/s
----------------------------
END OF INNODB MONITOR OUTPUT
============================
To unsubscribe from this group and stop receiving emails from it, send an email to dimstat+unsubscribe@googlegroups.com.
To post to this group, send email to dim...@googlegroups.com.
Visit this group at https://groups.google.com/group/dimstat.
For more options, visit https://groups.google.com/d/optout.
--
You received this message because you are subscribed to the Google Groups "dim_STAT" group.
To unsubscribe from this group and stop receiving emails from it, send an email to dimstat+unsubscribe@googlegroups.com.
Dimitri
Apr 12, 2016, 5:22:01 PM4/12/16
to dim...@googlegroups.com
Hi,
your status output was scanned rather correctly by the script in my
case, so I'm really surprised it's not working for you.. -- are sure
you using the latest STAT-service version ?..
well, to simplify any further debugging in similar cases, I've updated
the innodbSTAT script with printing in the header the names of scanned
sections tags, so instead of :
STAT-name STAT-value
db-server-online 1
...
you will see the following :
STAT-name
STAT-value::-SEM-TRX-FILE_IO-INS_BUFF-LOG-POOL-ROW_OP-END-
db-server-online 1
...
the "-SEM-TRX-FILE_IO-INS_BUFF-LOG-POOL-ROW_OP-END-" chain indicates
the scanned sections from the status output -- not impacting stat
collection, but should greatly help in troubleshooting..
the latest STAT-service version is now "rev.5.4" and you can download
it directly from http://dimitrik.free.fr as usually.. -- please,
install the latest version (x86 or x64 according your system and let
me know what is the innodbSTAT.sh output since then..
NOTE: you've also mentioned "innodbCMP.sh" script -- I don't remember
at all to have a such (or maybe a long time ago) -- so, please,
upgrade to the latest version..
Rgds,
-Dimitri
>> <http://192.168.23.48:3306/> -P 3306
>>>> 192.168.23.48 <http://192.168.23.48:3306/> -P 3306
your status output was scanned rather correctly by the script in my
case, so I'm really surprised it's not working for you.. -- are sure
you using the latest STAT-service version ?..
well, to simplify any further debugging in similar cases, I've updated
the innodbSTAT script with printing in the header the names of scanned
sections tags, so instead of :
STAT-name STAT-value
db-server-online 1
...
you will see the following :
STAT-name
STAT-value::-SEM-TRX-FILE_IO-INS_BUFF-LOG-POOL-ROW_OP-END-
db-server-online 1
...
the "-SEM-TRX-FILE_IO-INS_BUFF-LOG-POOL-ROW_OP-END-" chain indicates
the scanned sections from the status output -- not impacting stat
collection, but should greatly help in troubleshooting..
the latest STAT-service version is now "rev.5.4" and you can download
it directly from http://dimitrik.free.fr as usually.. -- please,
install the latest version (x86 or x64 according your system and let
me know what is the innodbSTAT.sh output since then..
NOTE: you've also mentioned "innodbCMP.sh" script -- I don't remember
at all to have a such (or maybe a long time ago) -- so, please,
upgrade to the latest version..
Rgds,
-Dimitri
Dimitri
Apr 12, 2016, 5:25:16 PM4/12/16
to dim...@googlegroups.com
RESENDING AGAIN... ;-)
coffeer...@gmail.com
Apr 12, 2016, 8:37:19 PM4/12/16
to dim_STAT
Now It's time is 2016-04-13 8:26 AM From China.
I download STATsrv-v5-Linux-x86-mysql.tgz and MD5SUM is bb1336cb9c78e6d5902944d37024ded5.
Deployment Path is /opt/pkg/tmp/ywh/STATsrv
STATsrv OS:Red Hat Enterprise Linux Server release 6.4 Beta (Santiago)
MySQL OS:Red Hat Enterprise Linux Server release 6.2 (Santiago)
The next step is the operation:
[root@docker-pre-5-31 bin]# cd /opt/pkg/tmp/ywh/STATsrv/bin
[root@docker-pre-5-31 bin]# cat .env-mysql
[root@docker-pre-5-31 bin]# sh innodbSTAT.sh 2
STAT-name STAT-value :: -
db-server-online 0
STAT-name STAT-value :: -
db-server-online 0
[root@docker-pre-5-31 bin]# exec WebX.mySQL5 x.innodbSTAT -Timeout 2 -Host 192.168.23.48 -User dim -Passwd dim
STAT-name STAT-value :: -
db-server-online 0
STAT-name STAT-value :: -
db-server-online 0
Unfortunately, these debugging parameters(-SEM-TRX-FILE_IO-INS_BUFF-LOG-POOL-ROW_OP-END) are not displayed
Dimitri
Apr 13, 2016, 4:02:22 PM4/13/16
to dim...@googlegroups.com
Hi,
as I'm just out of ideas what could go wrong on your side, I'm sending
you a slightly modified version of the script file "x.innodbSTAT" --
the script is now accepting the option "-Debug" ;-)) (don't know yet,
but probably I'll add a similar option to all the scripts to simplify
overall troubleshooting)..
so far, what you have to do :
- copy the attached script to your STATsrv/bin directory
- open your innodbSTAT.sh file with your preferred editor, go to the
last line with "exec" (where the main script is involved), after
"-Timeout $1" add " -Debug 1"; save the file..
- now start the "innodbSTAT.sh 5"
- leave it print 2-3 times the headers, then stop it with ^C
- in /tmp directory you should find a newly generated X_DEBUG* file
containing debug traces from the script execution.. => just send me
this file as email attachement and I'll try to analyze it then ;-)
(BTW, any particular reason you're using MariaDB and not MySQL? (just
curious ;-))
Rgds,
-Dimitri
>> On 4/12/16, coffeer...@gmail.com <javascript:> <coffeer...@gmail.com
>> >>>>> an email to dimstat+u...@googlegroups.com <javascript:>.
as I'm just out of ideas what could go wrong on your side, I'm sending
you a slightly modified version of the script file "x.innodbSTAT" --
the script is now accepting the option "-Debug" ;-)) (don't know yet,
but probably I'll add a similar option to all the scripts to simplify
overall troubleshooting)..
so far, what you have to do :
- copy the attached script to your STATsrv/bin directory
- open your innodbSTAT.sh file with your preferred editor, go to the
last line with "exec" (where the main script is involved), after
"-Timeout $1" add " -Debug 1"; save the file..
- now start the "innodbSTAT.sh 5"
- leave it print 2-3 times the headers, then stop it with ^C
- in /tmp directory you should find a newly generated X_DEBUG* file
containing debug traces from the script execution.. => just send me
this file as email attachement and I'll try to analyze it then ;-)
(BTW, any particular reason you're using MariaDB and not MySQL? (just
curious ;-))
Rgds,
-Dimitri
>> >>>>> To post to this group, send email to dim...@googlegroups.com
>> <javascript:>.
>> >>>>> Visit this group at https://groups.google.com/group/dimstat.
>> >>>>> For more options, visit https://groups.google.com/d/optout.
>> >>>>>
>> >>>> --
>> >>> You received this message because you are subscribed to the Google
>> Groups
>> >>>
>> >>> "dim_STAT" group.
>> >>> To unsubscribe from this group and stop receiving emails from it, send
>> >>>
>> an
>> >>>
>> >>> email to dimstat+u...@googlegroups.com <javascript:>.
>> >>>>> For more options, visit https://groups.google.com/d/optout.
>> >>>>>
>> >>>> --
>> >>> You received this message because you are subscribed to the Google
>> Groups
>> >>>
>> >>> "dim_STAT" group.
>> >>> To unsubscribe from this group and stop receiving emails from it, send
>> >>>
>> an
>> >>>
>> >>> To post to this group, send email to dim...@googlegroups.com
>> <javascript:>.
>> >>> Visit this group at https://groups.google.com/group/dimstat.
>> >>> For more options, visit https://groups.google.com/d/optout.
>> >>>
>> >>
>> >
>> > --
>> > You received this message because you are subscribed to the Google
>> Groups
>> > "dim_STAT" group.
>> > To unsubscribe from this group and stop receiving emails from it, send
>> an
>> > email to dimstat+u...@googlegroups.com <javascript:>.
>> >>> For more options, visit https://groups.google.com/d/optout.
>> >>>
>> >>
>> >
>> > --
>> > You received this message because you are subscribed to the Google
>> Groups
>> > "dim_STAT" group.
>> > To unsubscribe from this group and stop receiving emails from it, send
>> an
>> > To post to this group, send email to dim...@googlegroups.com
>> <javascript:>.
coffeer...@gmail.com
Apr 13, 2016, 8:23:56 PM4/13/16
to dim_STAT
Hi.
I download scripts x.innodbSTAT and copy it to STATsrv/bin.
edit innodbSTAT.sh, add options -Debug 1 to it. then to run it sh innodbSTAT.sh 5.
After the execution of the script, the debug file(X_DEBUG.58395) has been uploaded to the attachment.
Thank you very much for you all doing things in these days to me.
coffeer...@gmail.com
Apr 13, 2016, 11:18:55 PM4/13/16
to dim_STAT
Hi.
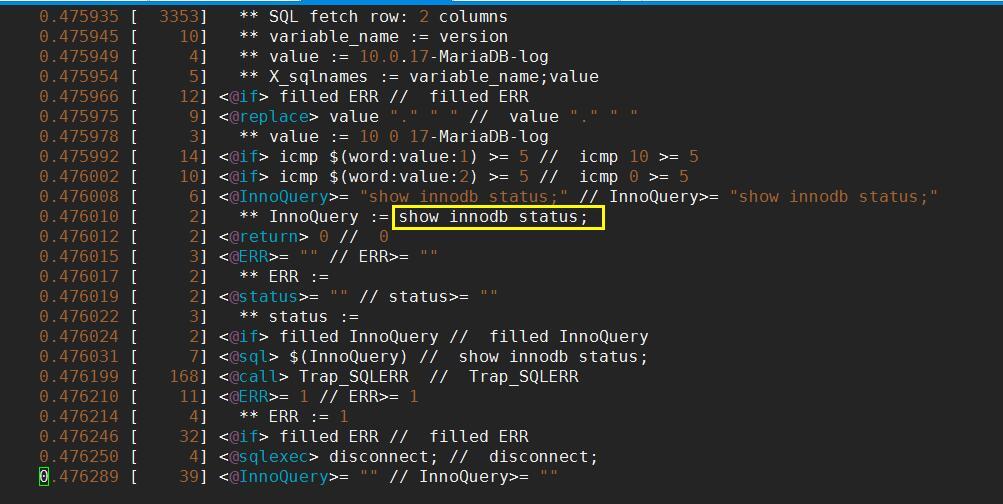
Maybe I found out where the problem is the scripts x.innoSTAT use command "show innodb status" to check innodb. I found a infomation from Debug file X_DEBUG.58395.
in fact, MariaDB use command "show engine innodb status" to display innodb status.
在 2016年4月14日星期四 UTC+8上午4:02:22,(dim)写道:
Dimitri
Apr 14, 2016, 5:18:01 AM4/14/16
to dim...@googlegroups.com
The syntax "show engine innodb status" came since MySQL 5.5, MariaDB just copied it ;-))
The script is deciding itself which syntax to use according the 'version' value, while in MariaDB case this could change..
What is the output of your "show variales like '%version%' ;" ?..
Seems like it's a time to adapt the script for more version variations ;-))
Rgds,
-Dimitri
coffeer...@gmail.com
Apr 14, 2016, 8:17:46 PM4/14/16
to dim_STAT
Hi !
About MariaDB Version is
MariaDB [(none)]> show variables like '%version%';
+-------------------------+---------------------+
| Variable_name | Value |
+-------------------------+---------------------+
| innodb_version | 5.6.22-72.0 |
| protocol_version | 10 |
| slave_type_conversions | |
| version | 10.0.17-MariaDB-log |
| version_comment | MariaDB Server |
| version_compile_machine | x86_64 |
| version_compile_os | Linux |
| version_malloc_library | bundled jemalloc |
+-------------------------+---------------------+
...
Dimitri
Apr 15, 2016, 10:14:37 AM4/15/16
to dim...@googlegroups.com
Ok, so far here is updated x.innodbSTAT script (in attachement) - just
copy it into your STATsrv/bin directory and normally it should just
work ;-))
once confirmed, I'll update all STAT-service tarballs..
Rgds,
-Dimitri
>> command "*show innodb status*" to check innodb. I found a infomation from
>>
>> Debug file X_DEBUG.58395.
>>
>> in fact, MariaDB use command "*show engine innodb status*" to display
copy it into your STATsrv/bin directory and normally it should just
work ;-))
once confirmed, I'll update all STAT-service tarballs..
Rgds,
-Dimitri
>>
>> Debug file X_DEBUG.58395.
>>
>> in fact, MariaDB use command "*show engine innodb status*" to display
coffeer...@gmail.com
Apr 17, 2016, 8:13:01 PM4/17/16
to dim_STAT
Year!!! It' work! so thank you very much!!!!
Reply all
Reply to author
Forward
0 new messages