Coordination numbers from PDF data
345 views
Skip to first unread message

Dimitry Grebenyuk
Mar 16, 2023, 2:41:50 AM3/16/23
to diffpy-users
Dear all,
I have a question regarding the calculation of coordination numbers from PDF data. I browsed several similar topics here on the Google group but none of them seems to address my issue.
I am currently working with PDF data of metal-oxide nanoparticles, but for educational purposes I decided to start off with a simpler example of Ni data from cmi_scripts and already encountered some problems.
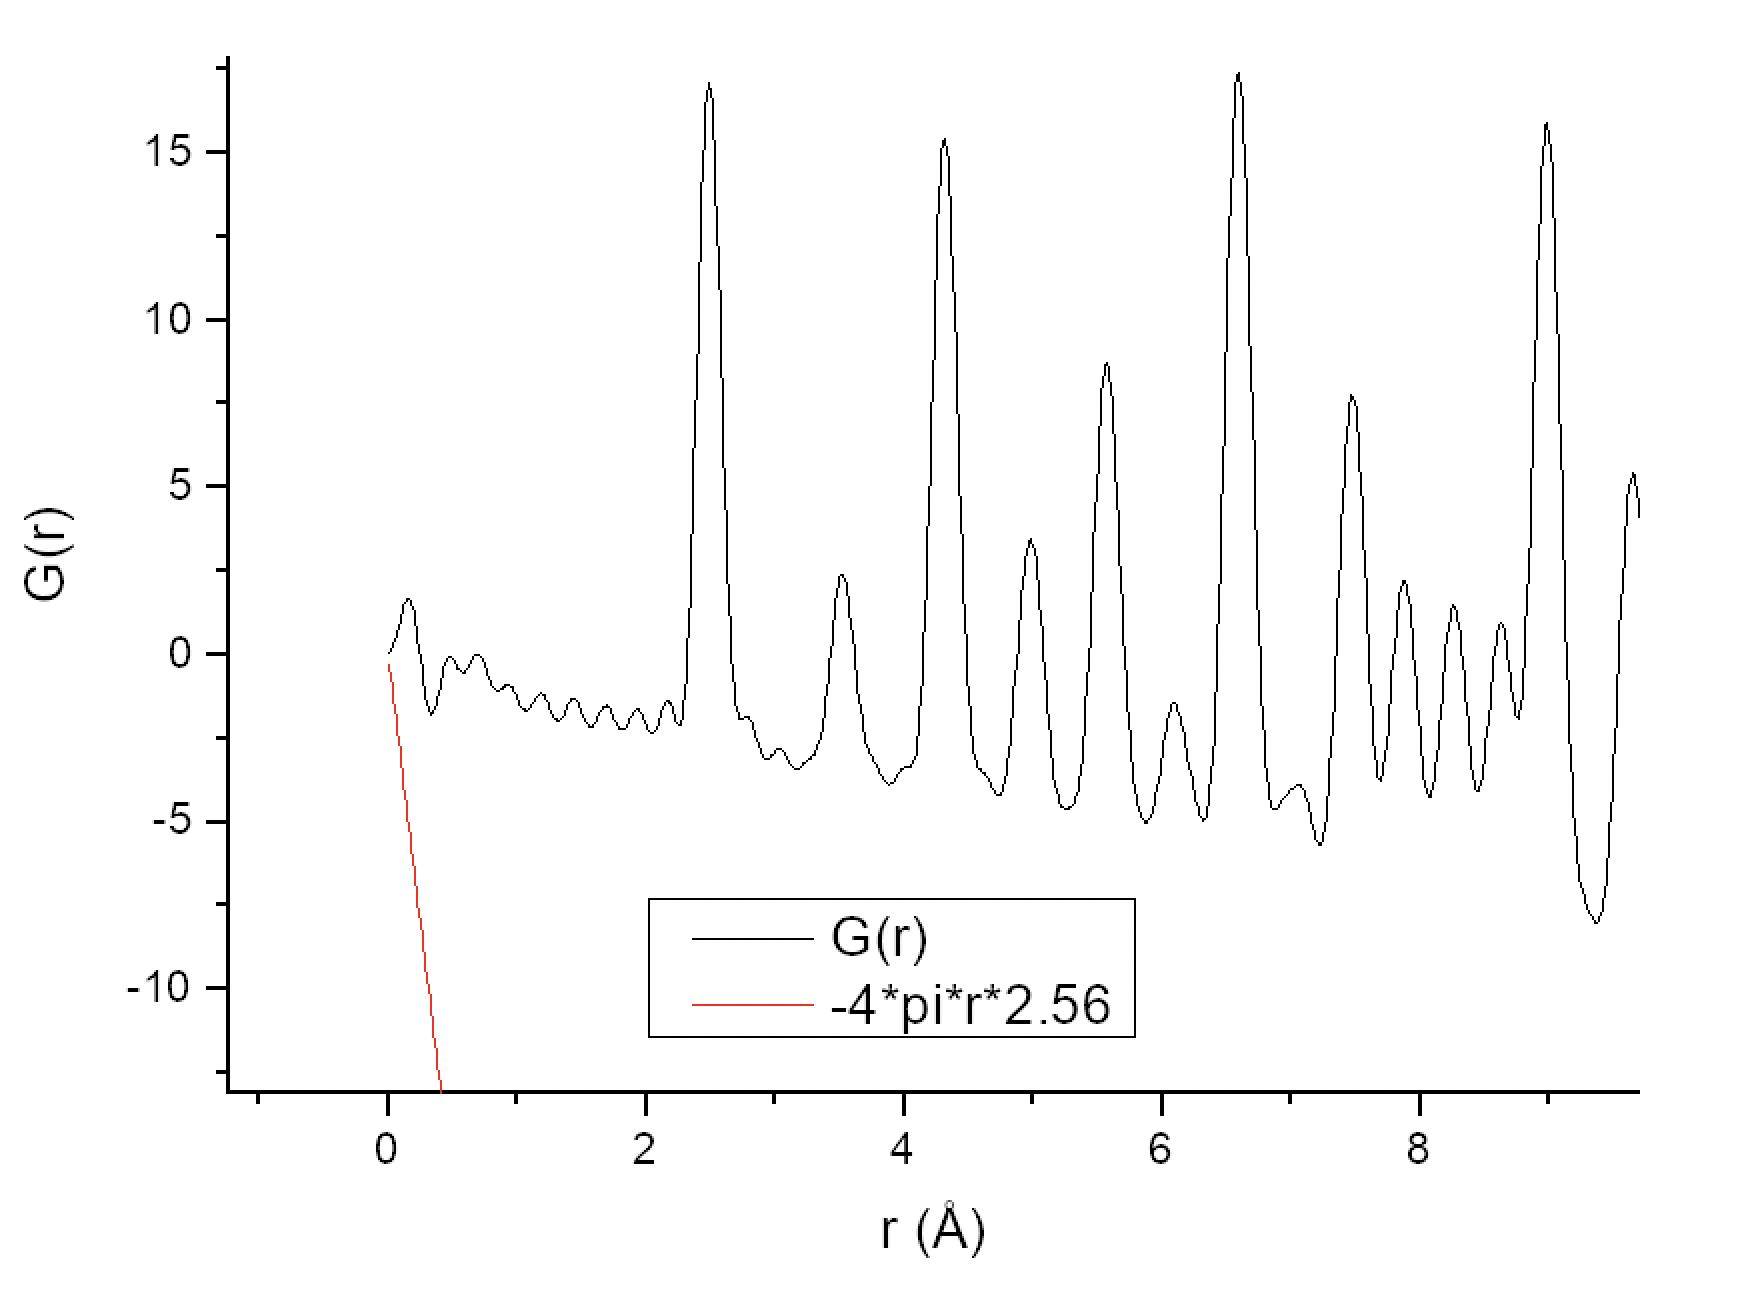
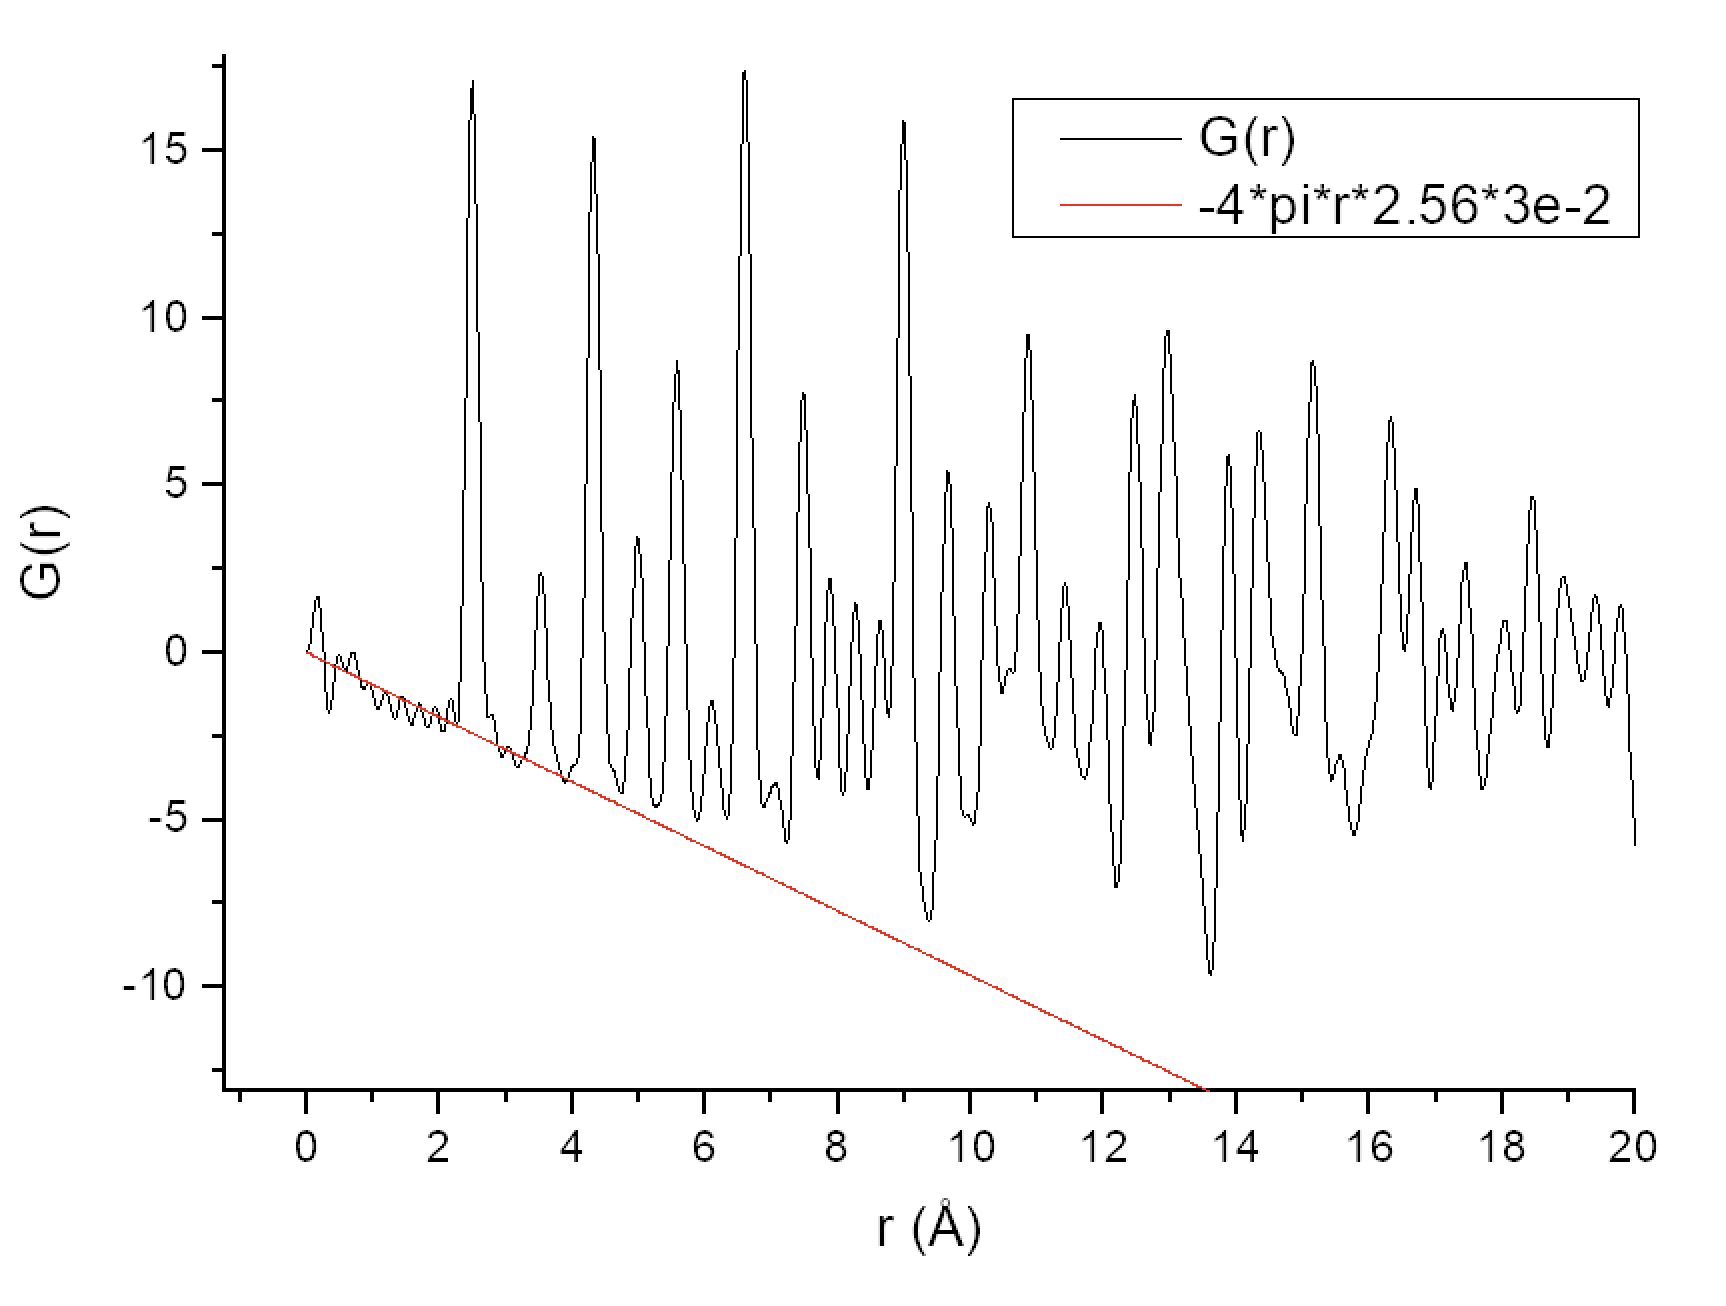
As I can understand from the literature (e.g. Underneath the Bragg Peaks), to calculate the coordination numbers I first need to calculate a Pair Correlation Function g(r) from my PDF using the formula g(r) = G(r)/(4πr×ρ0) + 1. At the same time, the term -4πr×ρ0 should act as a sloped baseline for my G(r). I understand ρ0 as a mean electron density per 1 Å3, so for Ni, I calculated it as (28e × 4 atoms per unit cell)/43.76 Å3 = 2.56 e/Å3. However, this results in the slope of -4πr×ρ0 being too far off of what it is expected to be (plot attached). Nevertheless, for the sake of getting a sane g(r) and also doubting the correctness of my ρ0 calculation, I decided to multiply the -4πr×ρ0 term by some coefficient to make the slope look correct (plot attached), and this turned out to be 3×10⁻². Then I calculated g(r) = G(r)/(4πr×2.56×3×10-2) + 1 and it looks great in contrast to what I got by simply doing g(r) = G(r)/(4πr×2.56) + 1. But integrating the first two peaks I get the numbers that are way off, not only in terms of the absolute values of the integrals but also in terms of their ratio (plot attached).
I have a question regarding the calculation of coordination numbers from PDF data. I browsed several similar topics here on the Google group but none of them seems to address my issue.
I am currently working with PDF data of metal-oxide nanoparticles, but for educational purposes I decided to start off with a simpler example of Ni data from cmi_scripts and already encountered some problems.
As I can understand from the literature (e.g. Underneath the Bragg Peaks), to calculate the coordination numbers I first need to calculate a Pair Correlation Function g(r) from my PDF using the formula g(r) = G(r)/(4πr×ρ0) + 1. At the same time, the term -4πr×ρ0 should act as a sloped baseline for my G(r). I understand ρ0 as a mean electron density per 1 Å3, so for Ni, I calculated it as (28e × 4 atoms per unit cell)/43.76 Å3 = 2.56 e/Å3. However, this results in the slope of -4πr×ρ0 being too far off of what it is expected to be (plot attached). Nevertheless, for the sake of getting a sane g(r) and also doubting the correctness of my ρ0 calculation, I decided to multiply the -4πr×ρ0 term by some coefficient to make the slope look correct (plot attached), and this turned out to be 3×10⁻². Then I calculated g(r) = G(r)/(4πr×2.56×3×10-2) + 1 and it looks great in contrast to what I got by simply doing g(r) = G(r)/(4πr×2.56) + 1. But integrating the first two peaks I get the numbers that are way off, not only in terms of the absolute values of the integrals but also in terms of their ratio (plot attached).
So I would be happy if anyone points out where my approach is flawed and how should I adjust my calculations to get the correct values at least for this example dataset and then move forward to my metal-oxide nanoparticles.
Any hints are appreciated.
Best,
Dimitry
Any hints are appreciated.
Best,
Dimitry
Dimitry Grebenyuk
Mar 16, 2023, 2:44:38 AM3/16/23
to diffpy-users
Here are the attachments
%20with%20areas.png?part=0.1&view=1)

Simon Billinge
Mar 16, 2023, 3:24:46 AM3/16/23
to diffpy...@googlegroups.com
Thanks for the great questions Dimitry. I am not sure what went wrong. Here are some things to think about:
1) The G(r) function we use is normalized per (average) atom in the material, which may explain your slope being off (we divided by the average form factor) so for Nickel the rho_0 would be 4/V_cell
2) we integrate the radial distribution function, R(r) in our terminology (see the paper in Acta A by Dave Keen for the rosetta stone of translations between the different definitions), to get N, the coordination number, and not what we call g(r). g(r) asymptotes to 1 at high r but R(r) diverges following
 . I didn't spend the time to check which function your one is, but have a look.
. I didn't spend the time to check which function your one is, but have a look.3) If you are doing this using experimental data and not simulated data it will only work if the data themselves are properly normalized.
Hope it helps.
S
--
You received this message because you are subscribed to the Google Groups "diffpy-users" group.
To unsubscribe from this group and stop receiving emails from it, send an email to diffpy-users...@googlegroups.com.
To view this discussion on the web visit https://groups.google.com/d/msgid/diffpy-users/391a6bf7-96d0-4346-a44e-776ff40b5870n%40googlegroups.com.
--
Simon Billinge
Professor, Columbia University
Dimitry Grebenyuk
Aug 2, 2023, 9:11:44 PM8/2/23
to diffpy-users
Hi Simon, sorry for the much delayed reply!
Thank you for the insights, they have been really helpful. I reexamined my calculations to get the correct R(r) function for integration, and now the coordination numbers for the example Ni data add up really good. Hope this helps me further with my actual system.
Best,
Dimitry
Reply all
Reply to author
Forward
0 new messages