strong background of diffraction data
30 views
Skip to first unread message

tongzh...@gmail.com
Nov 21, 2022, 8:51:25 AM11/21/22
to diffpy-users
Hi all,
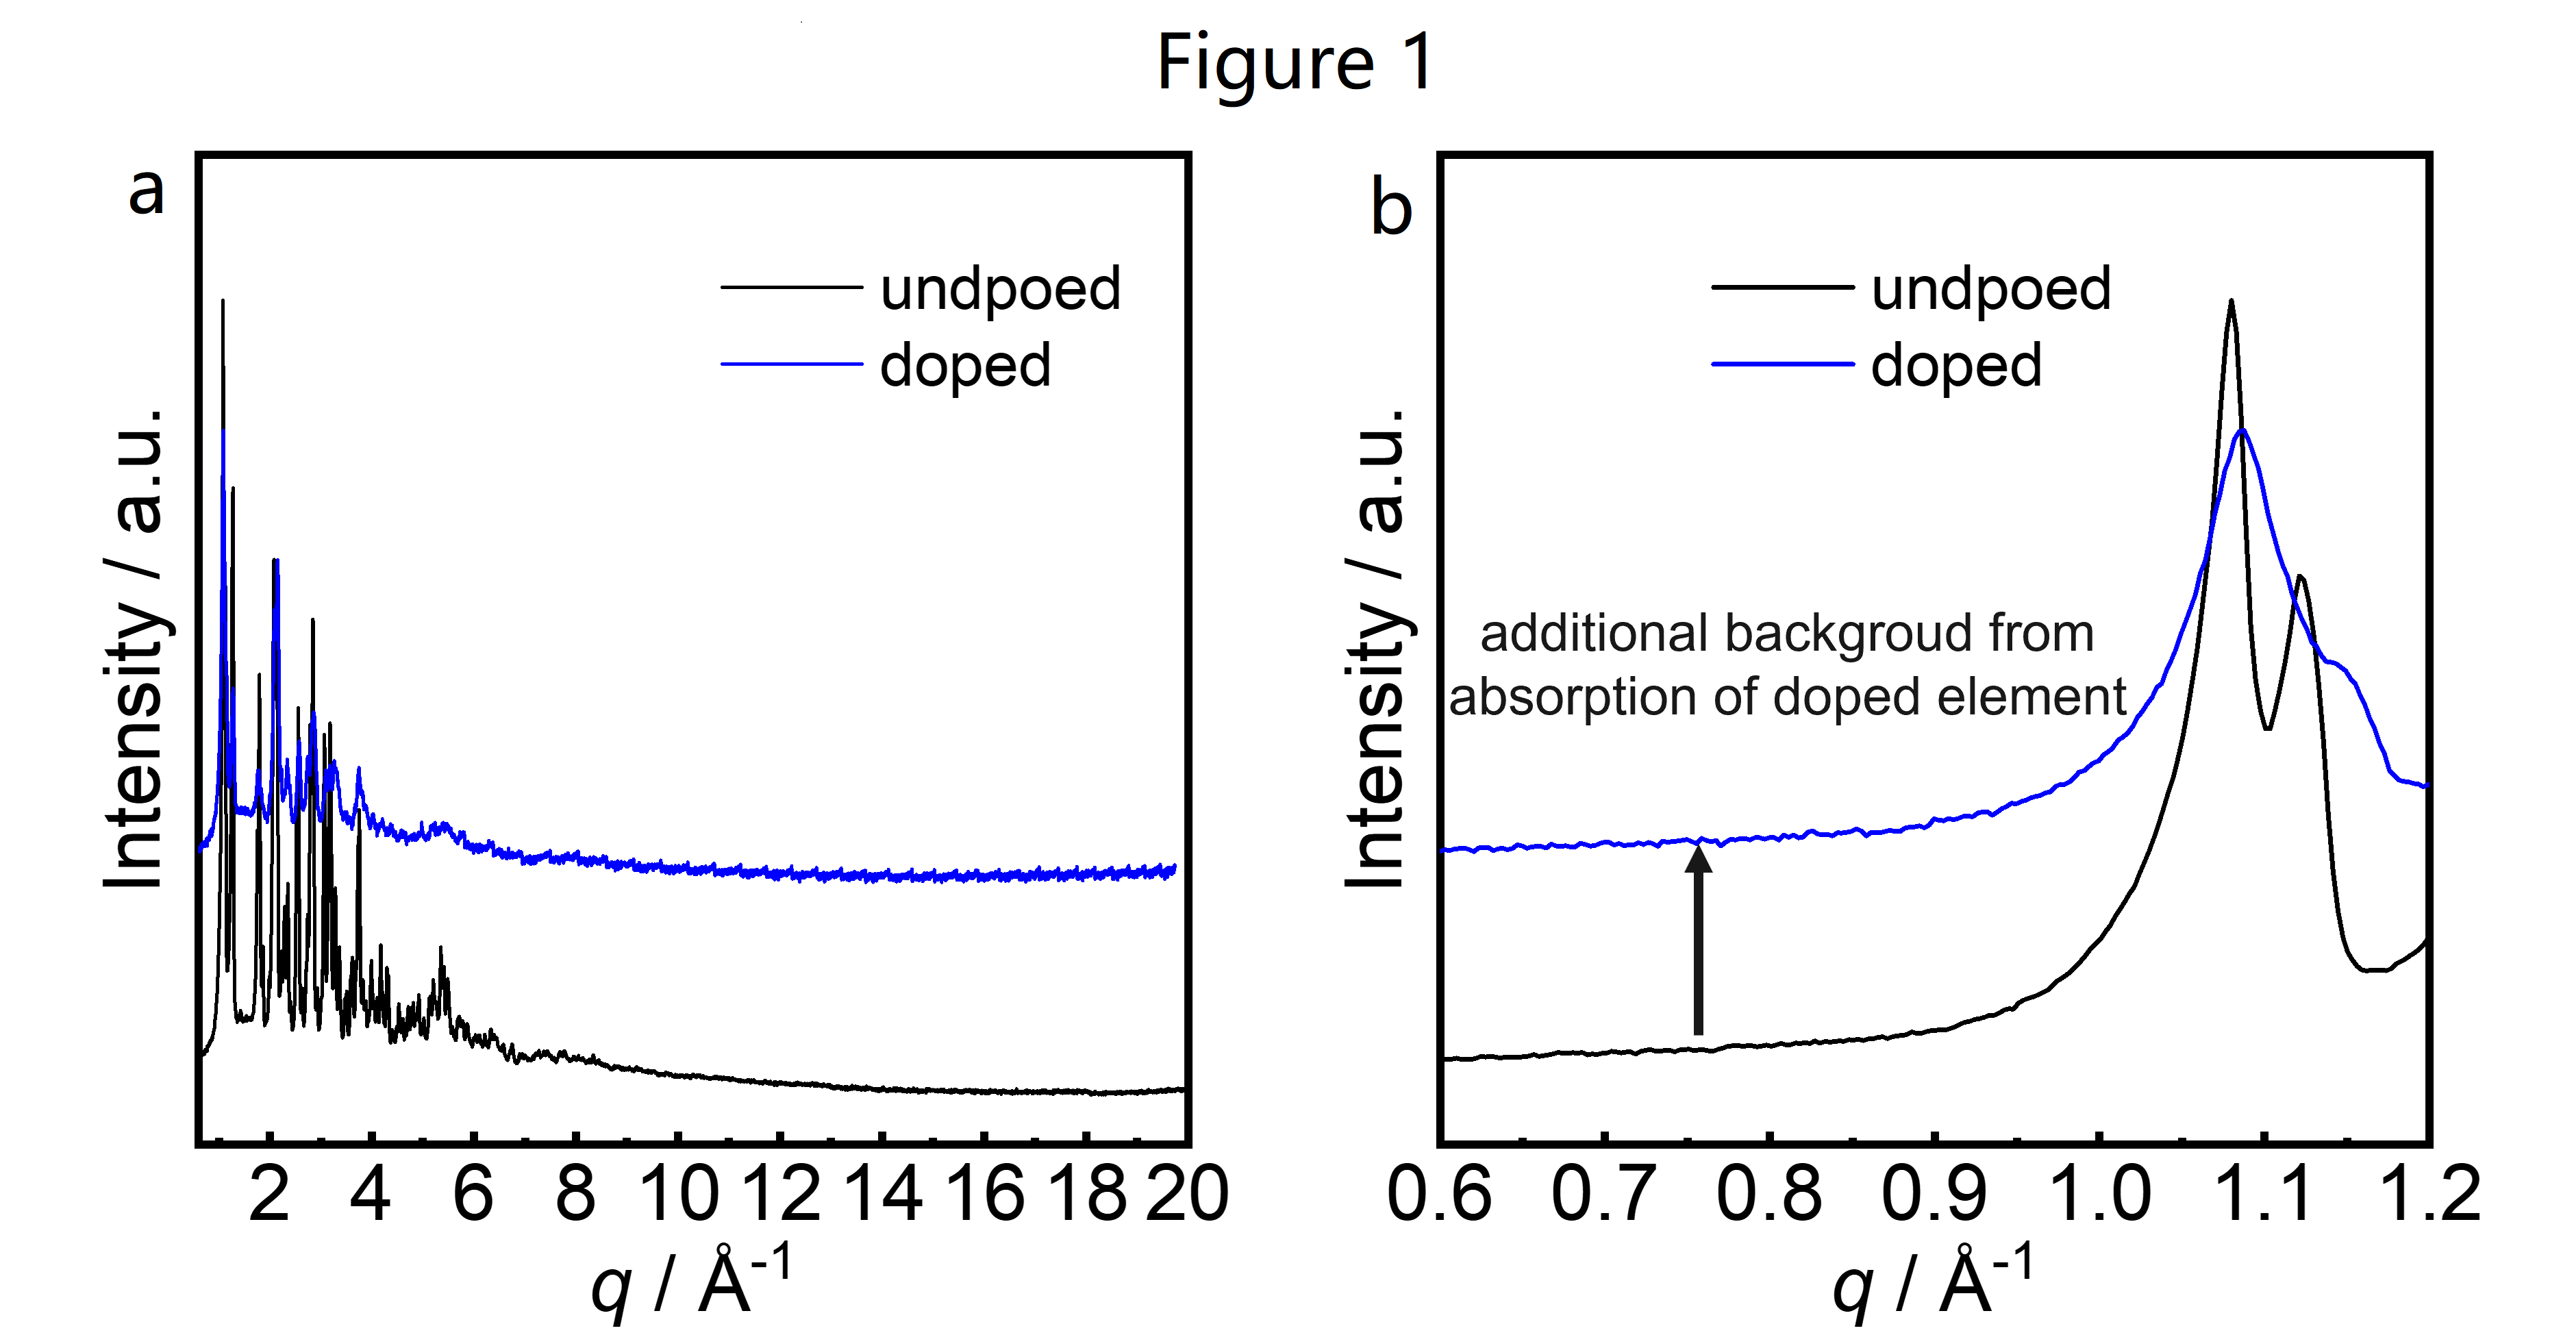
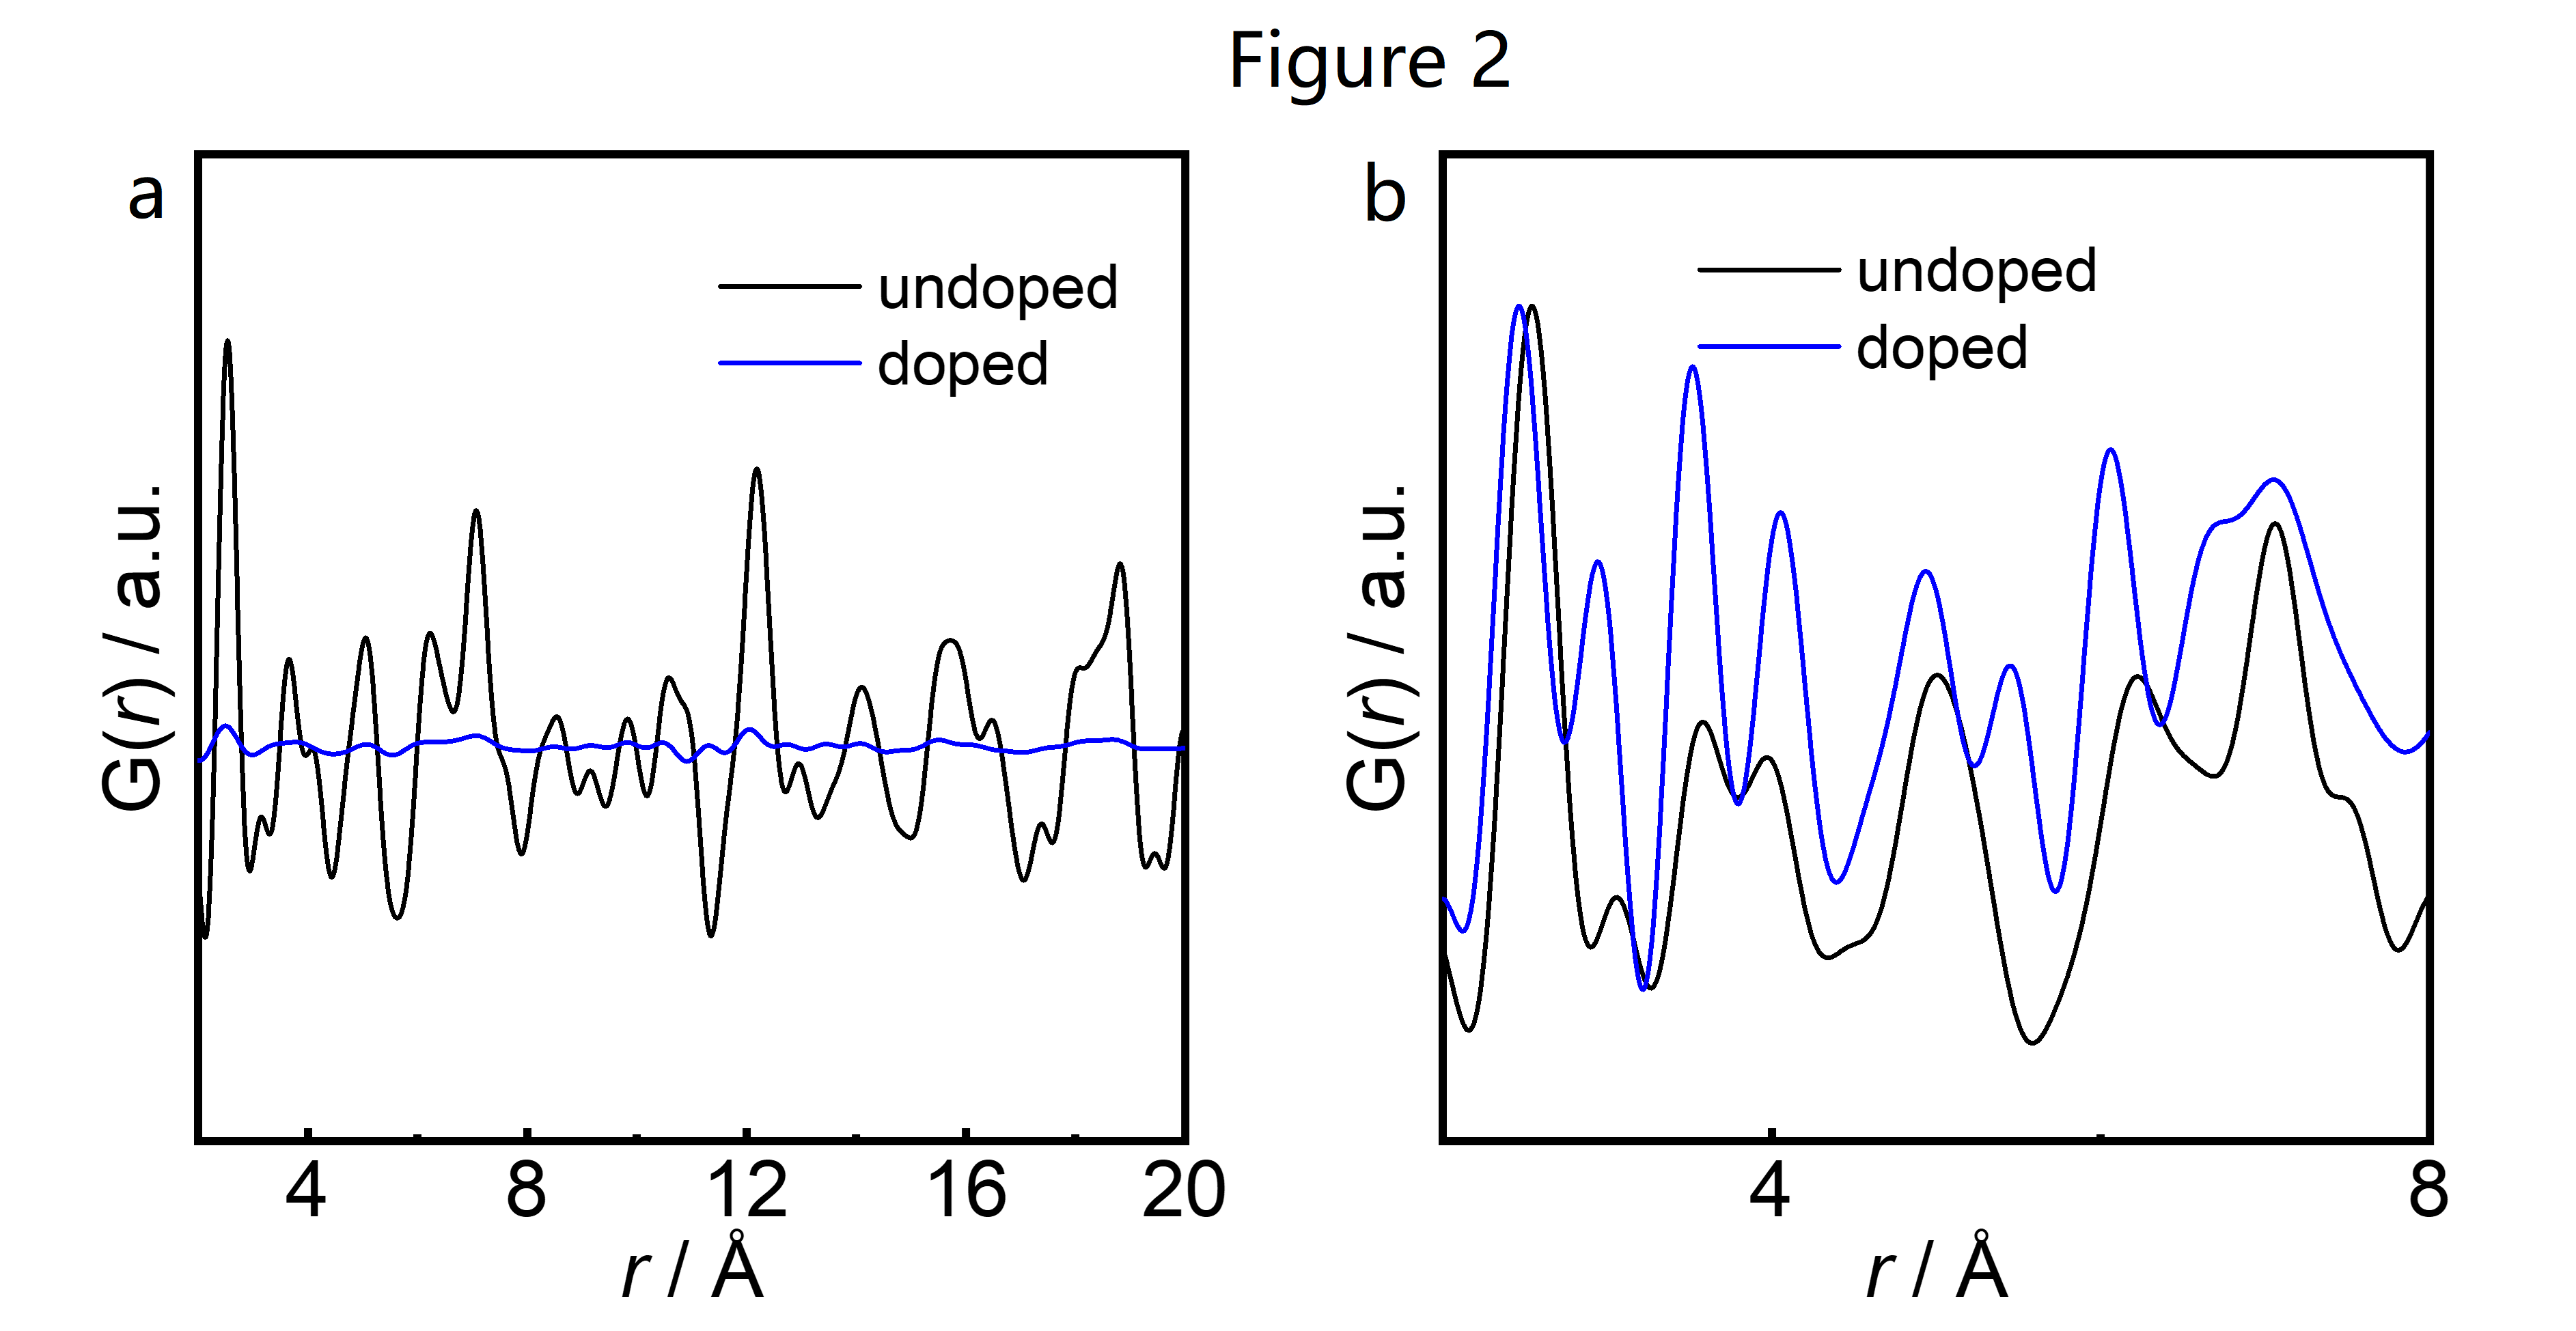
I measured XRD data under Ag source and wanted to get X-PDF data. However, the XRD pattern of our doped sample has a additional background because of the absorption of the doped element as shown in fig. 1, which results in the low intensity of G(r) (fig. 2a). After highet normalization of the G(r), the PDF of the doped sample has suspicious additional ripples as shown in fig. 2b.
Could you please let me know if the strong background of the diffraction data influences the reliability of the PDF analysis result? If yes, how can I get rid of the strong background influence?
Thanking all,
Best,
Tong

Peter Metz
Nov 21, 2022, 9:33:42 AM11/21/22
to diffpy...@googlegroups.com
Can you include additional details about the instrument you used to perform the measurement? And which software you are using for data reduction?
Fluorescence should be straight forward to account for, but you should try and minimize absorption experimentally. The typical recommendation for transmission diffraction measurements is to prepare samples with absorption and length products mu * r <= 1.
It would also be worthwhile to ensure you are able to reliably measure a standard reference material like silicon by your methods.
Cheers,
Peter
--
You received this message because you are subscribed to the Google Groups "diffpy-users" group.
To unsubscribe from this group and stop receiving emails from it, send an email to diffpy-users...@googlegroups.com.
To view this discussion on the web visit https://groups.google.com/d/msgid/diffpy-users/858fabb1-d57d-412c-b07b-9716ae068dd7n%40googlegroups.com.

Mikkel Juelsholt
Nov 21, 2022, 11:40:14 AM11/21/22
to diffpy-users
Hi Tong
Strong background signal should not influence your PDF: See for example this paper: https://journals.iucr.org/m/issues/2015/05/00/yu5008/
If you follow Peter's advice and hold on to mu * r <= 1 the absorption should be handled during the data reduction prior to the Fourier transform.
If you follow Peter's advice and hold on to mu * r <= 1 the absorption should be handled during the data reduction prior to the Fourier transform.
Before you move on to your PDF I would look into 2 things. The scattering from your doped sample has some weird repeating asymmetric peaks. Possibly an issue from stitching the data together? Absorption perhaps? I would fix that first. Secondly, the doped and undoped sample does look quite different. I would suggest starting with a Rietveld refinement on some data measured at a Cu source (Ag sources are not good for Rietveld refinement usually) so you know how the calculated PDF for each of your samples should look based on the average structure.
Cheers Mikkel
Reply all
Reply to author
Forward
0 new messages