<Engine exception> Singular matrix during minimization error
430 views
Skip to first unread message

Yiyi Yao
Oct 28, 2021, 12:34:11 AM10/28/21
to diffpy-users
Hello,
I have collected total scattering data on nanostructured and disordered samples of MoS2 at APS 11-ID-B, reduced it, and Fourier transformed it in GSAS-II to obtain the G(r). I want to use PDFgui to do some refinements, calculate lattice parameters, and possibly simulate PDF from known crystal structure.
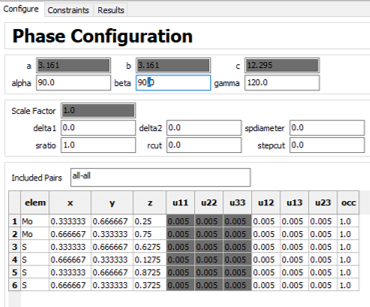
However, when I imported my G(r) data, and a reference CIF file of MoS2 (obtained from crystallography open database), and try to do any refinements, I keep getting this error. I have tried to change the isotropic and anistropic ADP to 0.005 since the CIF did not come with them, but still get this error.
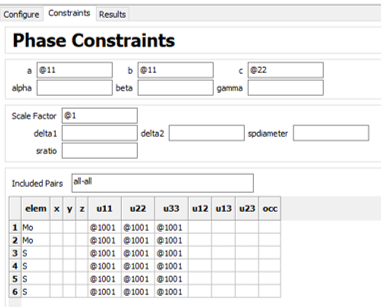
I have also tried contraining everything, and relaxing only the scale factor of the phase, or the unit cell parameters for the initial refinement, but to no avail. Even when I fix all parameters and relax nothing, it still gives this error.
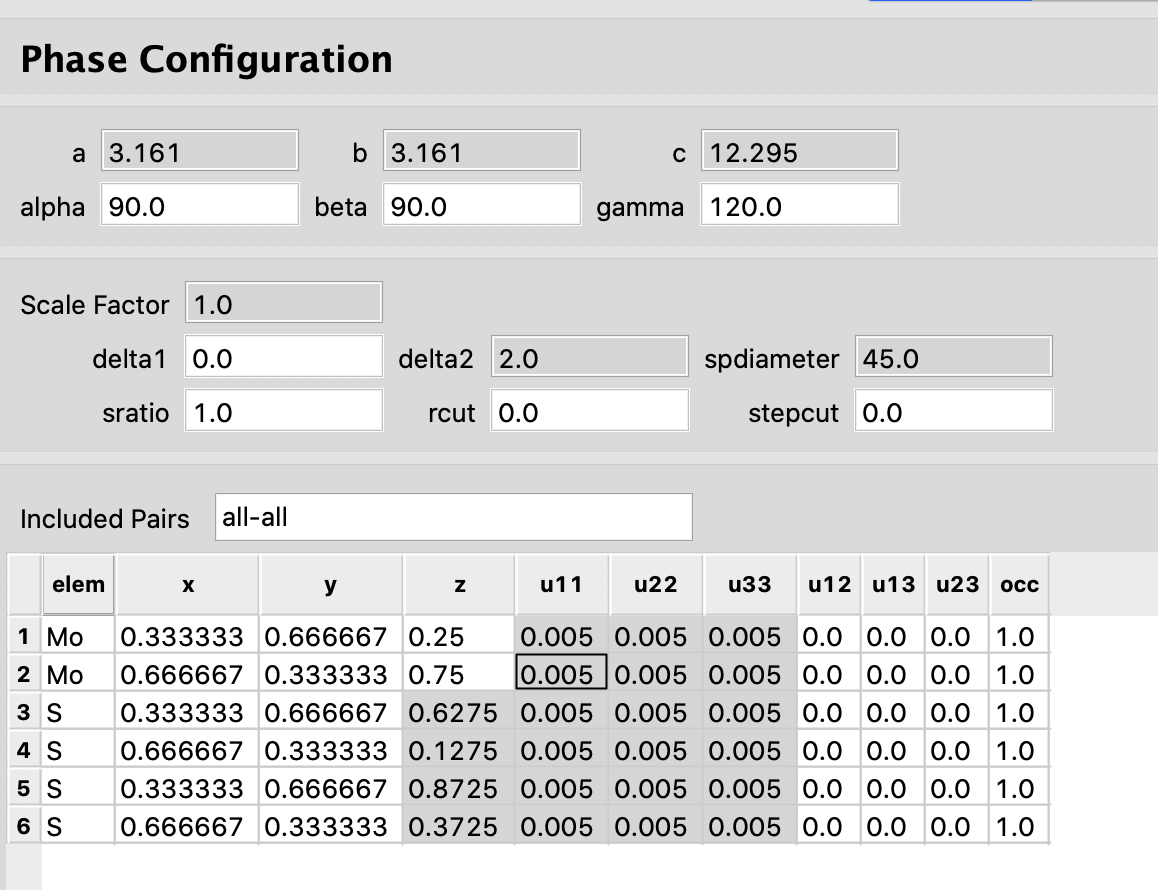
These are the starting conditions of my CIF file in the refinement:
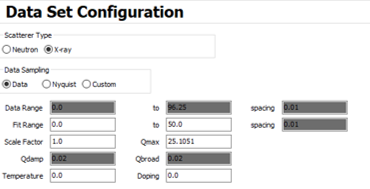
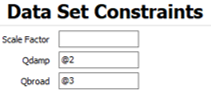
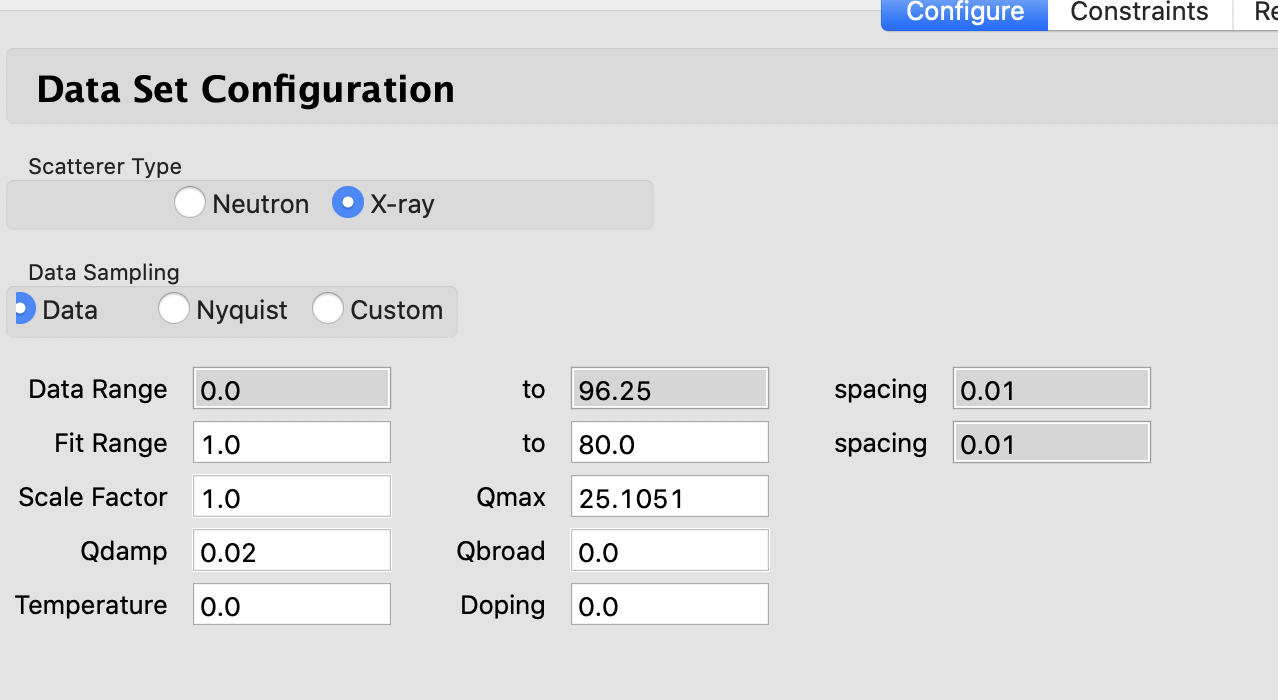
And these are the starting parameters for my experimental G(r).
I have also attached the .gr file and .cif file I'm using to try to do the refinement.
Any help would be greatly appreciated!
Yiyi Yao
Oct 28, 2021, 12:35:30 AM10/28/21
to diffpy-users
On a slightly tangential note, what is the meaning of the refined lattice parameters if the material is nearly amorphous (which I believe mine is from diffraction)?

Rohan Pokratath
Oct 28, 2021, 8:17:56 AM10/28/21
to diffpy...@googlegroups.com
Dear Yiyi,
I think the error is due to the fit range. Can you change the fit range, 1.5 to 50A°?
I hope this helps.
Kind regards,
Rohan
--
You received this message because you are subscribed to the Google Groups "diffpy-users" group.
To unsubscribe from this group and stop receiving emails from it, send an email to diffpy-users...@googlegroups.com.
To view this discussion on the web visit https://groups.google.com/d/msgid/diffpy-users/2129c002-ed3e-4fea-b577-d2647fddfa69n%40googlegroups.com.
|


Anna-Lena Hansen (IAM)
Oct 28, 2021, 8:18:02 AM10/28/21
to diffpy...@googlegroups.com
Dear Yivi Yao,
I guess you are trying to refine too many parameters at once. Have you tried fixing Qdamp and Qbroad to parameters from a standard (maybe ask you beamline scientist about these values or a standard measurement).
An make sure non of your parameters has the value 0, when you start your fitting.
Good luck,
Anna
--
You received this message because you are subscribed to the Google Groups "diffpy-users" group.
To unsubscribe from this group and stop receiving emails from it, send an email to diffpy-users...@googlegroups.com.
To view this discussion on the web visit https://groups.google.com/d/msgid/diffpy-users/2129c002-ed3e-4fea-b577-d2647fddfa69n%40googlegroups.com.
--
Dr. Anna-Lena Hansen
anna-len...@kit.edu

Institute for Applied Materials - Energy Storage Systems - IAM-ESS
-Development of Scattering Techniques-
Karlsruhe Institute of Technology – KIT

Hermann-von-Helmholtz-Platz 1
D-76344 Eggenstein-Leopoldshafen
Tel.: +49 721 608-28512

Mikkel Juelsholt
Oct 28, 2021, 4:25:28 PM10/28/21
to diffpy-users
Dear Yivi Yao
I can refine your dataset with the cif file just fine. I don't think the cif-file you use is the correct structure, but that is a different issue. Instead you make some mistakes which you should fix.
First of all you do not have an amorphous compound you have something nanocrystalline where you can usually understand the unit cell parameters just like in bulk crystals. Your PDF extend to around 50-60 Å which means you should set your SPdiameter to something similar. Right now the refinement will calculate a PDF very high values where you do not have any peaks. This will make the scale to become very low, which might hinder the fit.
To speed up the refinement you could let your rmax be 55 Å or so. And then when you have a good refinement then extend the fit to 90 Å. In general PDFgui (and also other type of refinement programs) does not like to refine on values that are 0 so I would always put refinement to start from 1 Å. Unless you are working with neutrons and are looking at hydrogen distances you should set it to 0.1-0.5 Å.
Next is your u values. You are correct that a good starting value is 0.005, however when you refine u11, u22 and u33 with the same parameter your thermal ellipsoids are all spherical which renders u12, u13 and u23 pointless. So I would just set those to 0, even if you later on plan to refine anisotropic thermal displacement parameters.
Then there are your instrument parameters Qdamp and Qbroad. As suggested by Anna-Lena you should obtain these from a suitable crystalline standard, such as Ni, Si or LaB6. They should never be refined unless you are refining the PDF from a standard.
No matter what your Qbroad is very high, so if it is from a standard there is something wrong.
Qdamp is in general between 0.01-0.04 and Qbroad is usually lower around, 0.001-0.01. Often you can just keep it to 0 without it affecting the refinement. It is also important to remember that the u values and Qbroad are quite correlated and you need to be careful when refining them at the same time. Also the SPdiameter and Qbroad are very correlated and should never be refined at the same time.
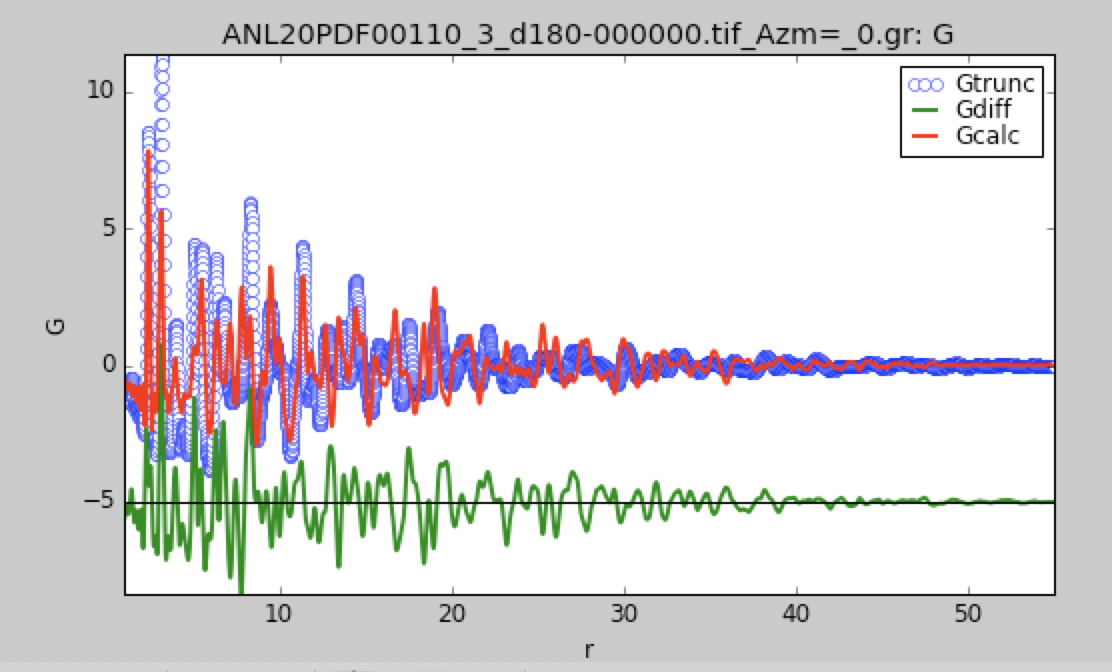
I have attached the parameters I used for refining your data set and the resulted fit. I refined first scale factor, then added the unit cell. Then u values, one for S and one for Mo, then the atomic positions and finally the Delta2. Since the structure is wrong I kept the SPdiameter at 45 Å, because otherwise it would only refine the first 20 Å.
Hope you make it work!
Mikkel
Yiyi Yao
Nov 1, 2021, 5:25:01 PM11/1/21
to diffpy-users
Great, thank you so much for all the advice! I will give it a try. Mikkel, may I ask what makes you think the CIF file is not correct? I thought it should correspond to the material unit cell and I'm not sure where I would go to find a better CIF.
Mikkel Juelsholt
Nov 1, 2021, 5:39:38 PM11/1/21
to diffpy-users
Well, the simple answer is that it does not fit.
But if you look at the fit I did, it starts with the ratio of the first 2 peaks at 2.41 and 3.16 Å, in the model the first peak is more intense than the second peak, but in the data it is the other way around. This suggest you need less Mo-S distances in your model. Other than that you are missing some distances in the model compared to the data at higher r. Maybe you have more than one phase?
I also noticed that you have a very intense peak at 0.22 Å. This is usually caused by bad corrections, I have never used GSAS for PDFs so I do not know how to improve it. In this forum we always recommend PDFgetX3 because it usually always does a good job. You could try that.
Building/finding the correct model is always the difficult part (but also the fun part!) of PDF modelling. I would start to go through databases, such as the crystallographic open database or maybe materials project to looks for different crystal structures of Mo, S and any other elements you could have in your material.
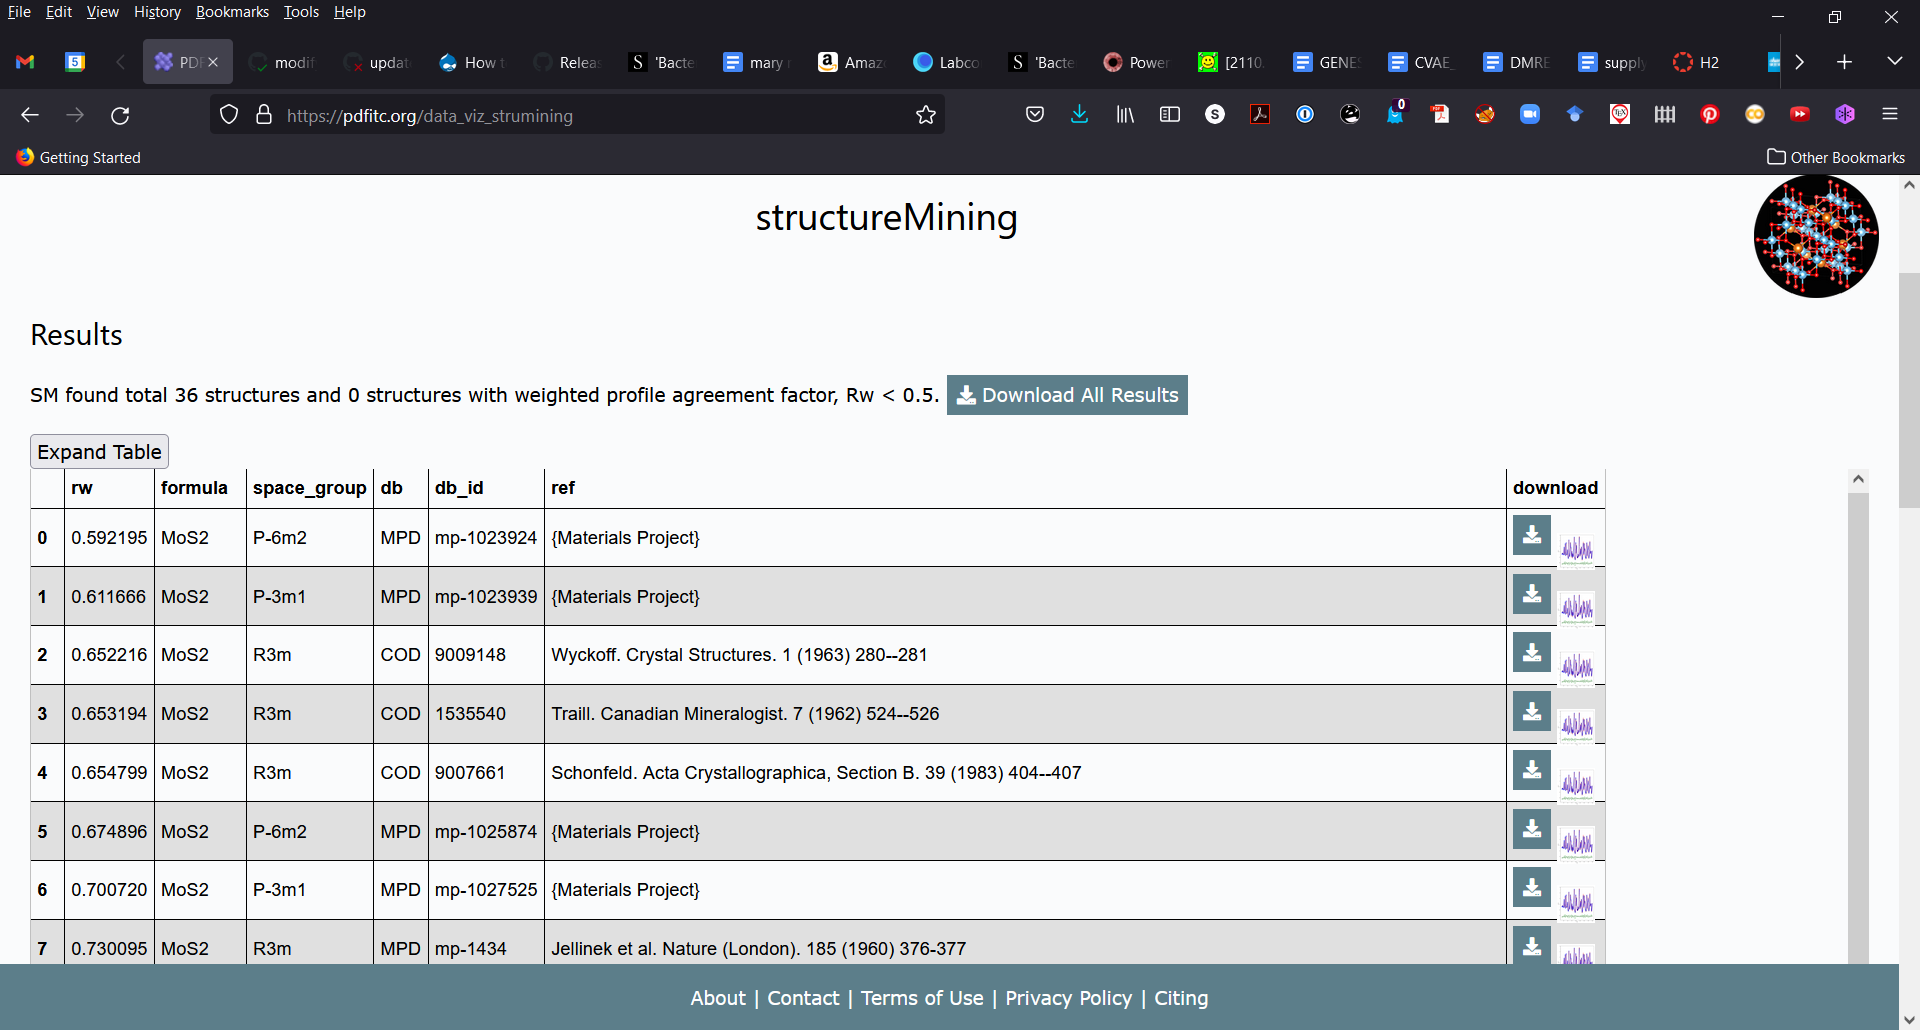
You could also try Simons new webpage: https://pdfitc.org/ Maybe it can work some magic for you.

Simon Billinge
Nov 1, 2021, 6:18:16 PM11/1/21
to diffpy...@googlegroups.com
Mikkel is right if you need to look for new structural candidates. Basically, if you upload the measured PDF to structureMining at pdfitc.org it automatically looks through both the crystallographic open database and the materials project databases and returns back the best candidate structures, just as Mikkel was suggesting....it isn't magic :)
To view this discussion on the web visit https://groups.google.com/d/msgid/diffpy-users/9a285b9d-80a9-4c6c-9e33-6c4144943585n%40googlegroups.com.
--
Simon Billinge
Professor, Columbia University
Physicist, Brookhaven National Laboratory

laura
Nov 3, 2021, 8:52:03 AM11/3/21
to diffpy-users
Thanks for the for this discussion.
May I ask..how do you do the fit then when you
have two or more phases.I mean the order of the refinement. Can you do
one phase first (the majority phase) and then the other phase?.
ThanKs in advance,
Laura
Mikkel Juelsholt
Nov 3, 2021, 10:44:49 AM11/3/21
to diffpy-users
Hi Laura
It, of course, depends on your system, but in most cases I would not do it.
If your minority phases only contribute very little to the data, then you can do it. In all other cases you are just going to make it more difficult for yourself. The refinement does not know that you have two phases in the data, so instead the refinement will try to describe your two phases with a single phase, which usually will go poorly.
Instead I would start by doing the same refinement routine for the phases. So first do the scale for both phases, then the unit cells and so on. In many cases this will do fine, but you will often encounter that you need to find the optimal way to refine the different parameters for the two phases.
Simon Billinge
Nov 3, 2021, 11:15:25 AM11/3/21
to diffpy...@googlegroups.com
Thanks so much for your detailed comments Mikkel, it is really appreciated.
That said, expand a bit on what Mikkel said, we routinely do multi-phase refinements with good success. We are working on a paper that describes in rather a lot of detail steps how to approach this when the sample is nanoparticulate (for crystalline samples it is generally easier). I will work to get the manuscript submitted to arXiv and can share it, hopefully shortly.
The short story is that, as Mikkel suggests, get a good fit to the major phase first, then add the minor phase and refine them both. It is rare that the parameters of the two phases correlate strongly so the refinements are usually stable, depending on how close in structure the second phase is to the first.
Another point Mikkel made is that if you don't include the second phase you can save yourself time. This is certainly true in the sense that you probably find that your refinement of the major phase is hardly affected by adding the second phase....just Rw goes down. So if you only care about the major phase you can save yourself some time. However, if you care about the second phase (what it is, how much of it is there) then the multi-phase fit is good.....and it is always scientifically satisfying to have confidence that you understand fully what is going on in your sample.
S
S
To view this discussion on the web visit https://groups.google.com/d/msgid/diffpy-users/9c5a5dec-7b81-43a1-813e-d716465d6f80n%40googlegroups.com.
Laura
Nov 4, 2021, 8:02:15 AM11/4/21
to diffpy...@googlegroups.com
Thank you both very much for your help. I have another question that earlier Mikkel quotes "in the model the first peak is more intense than the second, but in the data it is the other way around. This suggests that you need less Mo-S distances in your model".
What makes you have different intensities in the peaks?. I work with nanoparticles and electron diffraction... Does the particle morphology influence the PDF intensities? .If so, how is this adjustment done in PDFgui? By the way, I am waiting for you to publish the paper, I am sure it will be of great help in my case, please let us know!.
Thanks again!,
Laura
You received this message because you are subscribed to a topic in the Google Groups "diffpy-users" group.
To unsubscribe from this topic, visit https://groups.google.com/d/topic/diffpy-users/6EqTHS4COHU/unsubscribe.
To unsubscribe from this group and all its topics, send an email to diffpy-users...@googlegroups.com.
To view this discussion on the web visit https://groups.google.com/d/msgid/diffpy-users/CANugsUGYwtMaHtFc3QpnJVFakyepxhBVr2anWu6C6e_mS-D3gg%40mail.gmail.com.
Mikkel Juelsholt
Nov 4, 2021, 1:12:11 PM11/4/21
to diffpy-users
Hi Laura
Since the PDF is obtained from scattering data the PDF peak intensities are in general determined by the number of atomic pair contributing to the peak and the scattering power of those atoms. So if the peak intensities in your model are to high you either need less of the distances or include some atoms which scatter less.
Regarding morphologies, the size and shape of a particle does affect the PDF. However you cannot adjust this in PDFgui as PDFgui only have the option for a spherical model. If you want to play around with more advanced models then you need to use Diffpy instead.
Mikkel
Simon Billinge
Nov 5, 2021, 7:19:09 AM11/5/21
to diffpy...@googlegroups.com
Hi Yiyi,
This is what structureMining@PDFitc returned for your first dataset:
and the structure ended up looking like this:
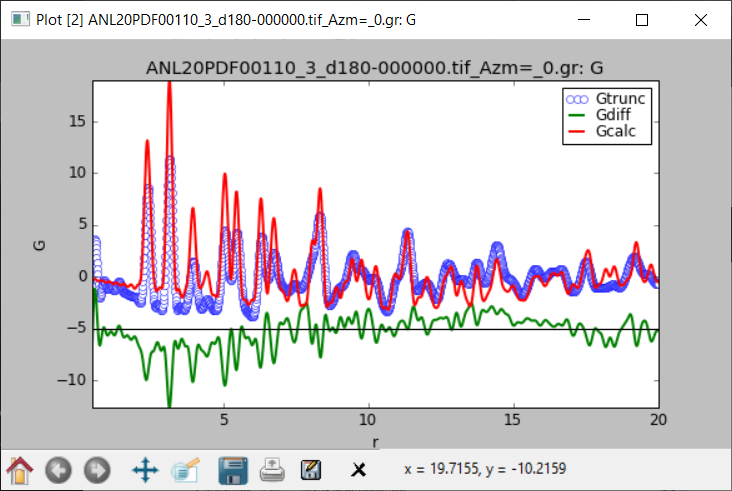
The structure is clearly correct...peak positions and relative intensities are fine, but you have a nasty sinusoidal background that the model can't handle which may be coming from your data reduction. A large peak at low-r that should be excluded with a higher Q_min, for example.
To view this discussion on the web visit https://groups.google.com/d/msgid/diffpy-users/4672a302-2901-4e2b-8753-895ea20970e2n%40googlegroups.com.
Reply all
Reply to author
Forward
0 new messages