Control of Display on Sunburst chart
22 views
Skip to first unread message

steph...@gmail.com
Jun 10, 2020, 2:14:40 PM6/10/20
to RAWGraphs (formerly Raw by DensityDesign)
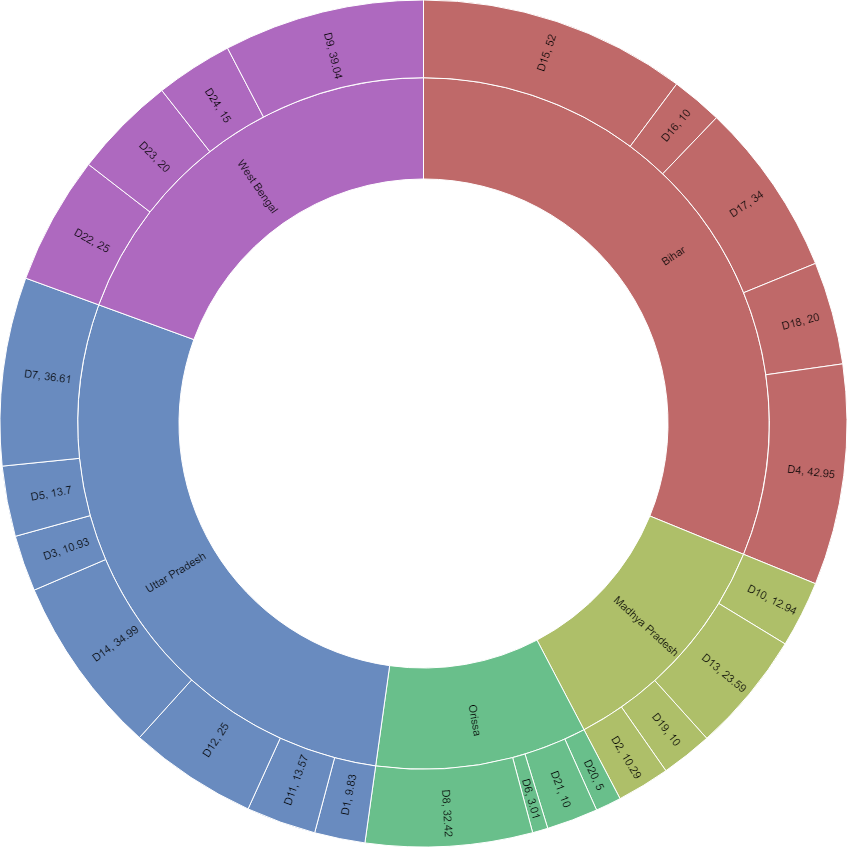
I need to control the display of the variables shown in the chart.
1. The numeric value needs to be appear on a line below the value of the variable (D1, D2, etc)
2. The direction of the labels displayed need to be controlled
3. Is there any mechanism to add a tool-tip?
4. Is there a mechanism to approximate the numbers or control the rounding or display of decimals
Reply all
Reply to author
Forward
0 new messages