Huge confusion, please advise
503 views
Skip to first unread message

Ashley Conard
Dec 31, 2019, 9:50:47 PM12/31/19
to deep...@googlegroups.com
Hello Deeptools,

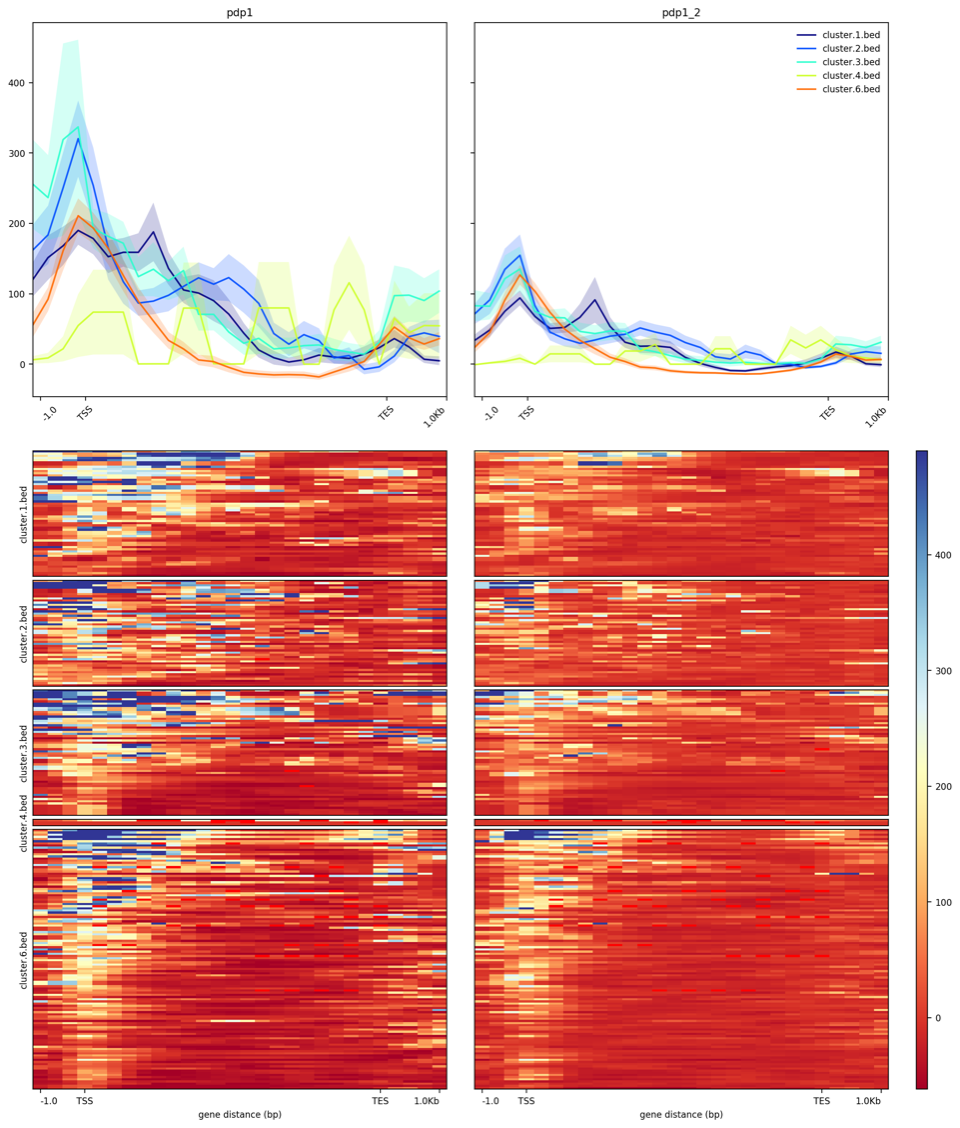
I really enjoy using your methods to visualize my ChIP-seq data. I am having 3 large problems. 1) I am having trouble plotting. I am getting plots like this (below), and I am not sure what to do. I will explain my steps below. Additionally - 1) I do not know how to plot a confidence interval and 2) I do not know how to integrate replicates. I have been looking online but I am not finding answers that are working.
Steps:
1) I have the 5 lists of genes in this format 'chrom', 'start', 'end', 'gene_id', 'gene_name','strand' (i.e. cluster.1.bed, ..., cluster.6.bed)
2) I have 1 bigWig file extracted from https://www.encodeproject.org/files/ENCFF189TQF/ and I call it pdp1.bigWig
3) I run the following code:
$computeMatrix scale-regions -S pdp1.bigWig -R cluster.*.bed --beforeRegionStartLength 1000 --afterRegionStartLength 1000 -o matrix.mat.gz --skipZeros --missingDataAsZero
$plotHeatmap -m matrix.mat.gz -out exampleheatmap_pdp1.png --sortRegions descend
Thank you so much!
Ashley
Ashley Conard
Jan 2, 2020, 4:30:59 PM1/2/20
to Devon Ryan, deepTools
Hello Devon,
Thank you enormously for your help! I was able to add --plotType se to show the standard error. I will look into the deepStats package.
As I am using pre-processed bigwig files, how would you suggest showing the log2 change, rather than the counts as are shown here currently?
If you have replicates, just supply them to the `-S` option in computeMatrix: `computeMatrix scale-regions -S pdp1.bigWig pdp1.replicate2.bigWig ...`
Unfortunately (as you likely know) each replicate is plotted next to each other rather than being leveraged to produce 1 average profile. For example here below. What I found may work is to take an average over the biological replicate bigwig files using wiggletools.
Thank you again and I look forward to hearing from you!
Sincerely,
Ashley
On Jan 1, 2020, at 3:15 AM, Devon Ryan <dpr...@dpryan.com> wrote:DeepTools itself doesn't plot confidence intervals, but you can plot the standard deviation instead (--plotType std). If you absolutely need confidence intervals then I think dsCompareCurves in the deepStats package can do that. Confidence intervals need to be computed by bootstrapping, which I never really wanted to implement.If you have replicates, just supply them to the `-S` option in computeMatrix: `computeMatrix scale-regions -S pdp1.bigWig pdp1.replicate2.bigWig ...`--
Devon Ryan, Ph.D.
Email: dpr...@dpryan.com
Data Manager/Bioinformatician
Max Planck Institute of Immunobiology and Epigenetics
Stübeweg 5179108 Freiburg
On Wed, Jan 1, 2020 at 3:50 AM Ashley Conard <ashley...@brown.edu> wrote:
Hello Deeptools,I really enjoy using your methods to visualize my ChIP-seq data. I am having 3 large problems. 1) I am having trouble plotting. I am getting plots like this (below), and I am not sure what to do. I will explain my steps below. Additionally - 1) I do not know how to plot a confidence interval and 2) I do not know how to integrate replicates. I have been looking online but I am not finding answers that are working.
<exampleheatmap_pdp1.png>
Steps:1) I have the 5 lists of genes in this format 'chrom', 'start', 'end', 'gene_id', 'gene_name','strand' (i.e. cluster.1.bed, ..., cluster.6.bed)2) I have 1 bigWig file extracted from https://www.encodeproject.org/files/ENCFF189TQF/ and I call it pdp1.bigWig3) I run the following code:$computeMatrix scale-regions -S pdp1.bigWig -R cluster.*.bed --beforeRegionStartLength 1000 --afterRegionStartLength 1000 -o matrix.mat.gz --skipZeros --missingDataAsZero$plotHeatmap -m matrix.mat.gz -out exampleheatmap_pdp1.png --sortRegions descendThank you so much!Ashley
--
You received this message because you are subscribed to the Google Groups "deepTools" group.
To unsubscribe from this group and stop receiving emails from it, send an email to deeptools+...@googlegroups.com.
To view this discussion on the web visit https://groups.google.com/d/msgid/deeptools/847BCFE2-50DD-4110-A264-61A95D415BFB%40brown.edu.

Devon Ryan
Jan 3, 2020, 4:58:12 AM1/3/20
to Ashley Conard, deepTools
DeepTools itself doesn't plot confidence intervals, but you can plot the standard deviation instead (--plotType std). If you absolutely need confidence intervals then I think dsCompareCurves in the deepStats package can do that. Confidence intervals need to be computed by bootstrapping, which I never really wanted to implement.
If you have replicates, just supply them to the `-S` option in computeMatrix: `computeMatrix scale-regions -S pdp1.bigWig pdp1.replicate2.bigWig ...`
--
Devon Ryan, Ph.D.
Email: dpr...@dpryan.com
Data Manager/Bioinformatician
Max Planck Institute of Immunobiology and Epigenetics
Stübeweg 51
Devon Ryan, Ph.D.
Email: dpr...@dpryan.com
Data Manager/Bioinformatician
Max Planck Institute of Immunobiology and Epigenetics
Stübeweg 51
79108 Freiburg
On Wed, Jan 1, 2020 at 3:50 AM Ashley Conard <ashley...@brown.edu> wrote:
--
Ashley Conard
Jan 3, 2020, 11:47:05 PM1/3/20
to Devon Ryan, deepTools
Hello Devon,
I will be presenting some of these results I am getting at a Harvard Medical School meeting in a couple days. I look forward to talking about deeptools!
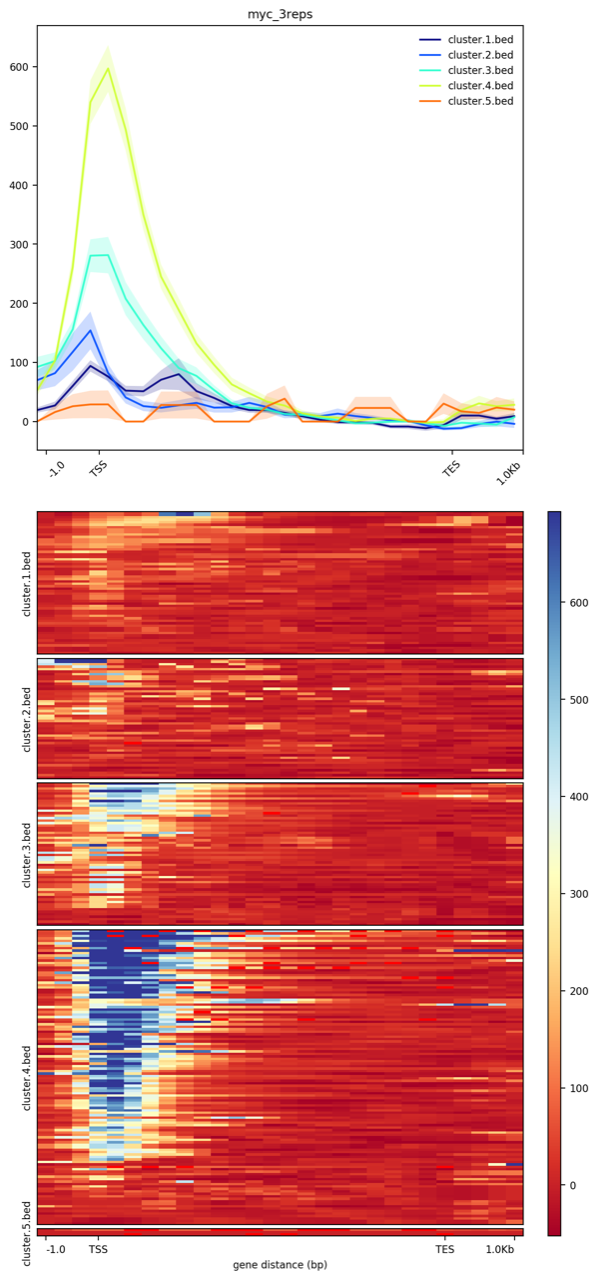
Is it possible to compute a significance test (such as KS-distance) to determine the distance between distributions? I know that with wiggletools I can compute the Wilcoxon rank sum test between .bigWig files, but what I have is the output from computeMatrix and plotHeatmap. For example if I wanted to determine the significance (i.e. return a p-value) between the light green distribution and the light blue distribution.
Best,
Ashley
On Jan 3, 2020, at 5:08 AM, Devon Ryan <dpr...@dpryan.com> wrote:If you want a log2 change then you can use bigwigCompare, but then you'll need something for the change to be relative to. For averaging replicates, you can use the wiggletools package, which can also do things like log2 transform the count data.Devon
--
Devon Ryan, Ph.D.
Email: dpr...@dpryan.com
Data Manager/Bioinformatician
Max Planck Institute of Immunobiology and Epigenetics
Stübeweg 5179108 Freiburg
On Thu, Jan 2, 2020 at 10:31 PM Ashley Conard <ashley...@brown.edu> wrote:
Hello Devon,Thank you enormously for your help! I was able to add --plotType se to show the standard error. I will look into the deepStats package.As I am using pre-processed bigwig files, how would you suggest showing the log2 change, rather than the counts as are shown here currently?
If you have replicates, just supply them to the `-S` option in computeMatrix: `computeMatrix scale-regions -S pdp1.bigWig pdp1.replicate2.bigWig ...`Unfortunately (as you likely know) each replicate is plotted next to each other rather than being leveraged to produce 1 average profile. For example here below. What I found may work is to take an average over the biological replicate bigwig files using wiggletools.
<exampleheatmapPdp1_bin250_se.png>
To view this discussion on the web visit https://groups.google.com/d/msgid/deeptools/DCCB0F0B-43F8-451F-9902-F6BABA34BF6A%40brown.edu.
Ashley Conard
Jan 6, 2020, 12:22:45 AM1/6/20
to Devon Ryan, deepTools
Hello Devon,
I am having a look at the deepStats package - thank you! Do you know if it is possible to either set the colors for each cluster or make everything grey? I see that --colorMap and --colorList change the heatmap but I am looking for distribution level color determination.
I would like to set the colors of each distribution.
What I have so far is
Best,
Ashley
On Jan 4, 2020, at 3:01 AM, Devon Ryan <dpr...@dpryan.com> wrote:Have a look at the companion deepStats package, which can compute statistics between the curves: https://github.com/gtrichard/deepStats
Devon--
Devon Ryan, Ph.D.
Email: dpr...@dpryan.com
Data Manager/Bioinformatician
Max Planck Institute of Immunobiology and Epigenetics
Stübeweg 5179108 Freiburg
On Sat, Jan 4, 2020 at 5:47 AM Ashley Conard <ashley...@brown.edu> wrote:
Hello Devon,I will be presenting some of these results I am getting at a Harvard Medical School meeting in a couple days. I look forward to talking about deeptools!Is it possible to compute a significance test (such as KS-distance) to determine the distance between distributions? I know that with wiggletools I can compute the Wilcoxon rank sum test between .bigWig files, but what I have is the output from computeMatrix and plotHeatmap. For example if I wanted to determine the significance (i.e. return a p-value) between the light green distribution and the light blue distribution.
<heatmap_genes.clusters.merged_se_myc_wo.png>
To view this discussion on the web visit https://groups.google.com/d/msgid/deeptools/6C6DADDA-BEF7-47EC-B3F5-958BEAD6763F%40brown.edu.
Ashley Conard
Jan 6, 2020, 12:22:50 AM1/6/20
to Devon Ryan, deepTools
Hello Devon,
I am having a look at the deepStats package - thank you! Do you know if it is possible to either set the colors for each cluster or make everything grey? I see that --colorMap and --colorList change the heatmap but I am looking for distribution level color determination.
I would like to set the colors of each distribution.
What I have so far is

Have a look at the companion deepStats package, which can compute statistics between the curves: https://github.com/gtrichard/deepStats
Devon--
Devon Ryan, Ph.D.
Email: dpr...@dpryan.com
Data Manager/Bioinformatician
Max Planck Institute of Immunobiology and Epigenetics
Stübeweg 5179108 Freiburg
On Sat, Jan 4, 2020 at 5:47 AM Ashley Conard <ashley...@brown.edu> wrote:
Hello Devon,I will be presenting some of these results I am getting at a Harvard Medical School meeting in a couple days. I look forward to talking about deeptools!Is it possible to compute a significance test (such as KS-distance) to determine the distance between distributions? I know that with wiggletools I can compute the Wilcoxon rank sum test between .bigWig files, but what I have is the output from computeMatrix and plotHeatmap. For example if I wanted to determine the significance (i.e. return a p-value) between the light green distribution and the light blue distribution.
<heatmap_genes.clusters.merged_se_myc_wo.png>
To view this discussion on the web visit https://groups.google.com/d/msgid/deeptools/6C6DADDA-BEF7-47EC-B3F5-958BEAD6763F%40brown.edu.

Devon Ryan
Jan 6, 2020, 3:32:57 AM1/6/20
to Ashley Conard, Devon Ryan, deepTools
We never implemented per cluster coloring, sorry.
Sent from my iPhone
To view this discussion on the web visit https://groups.google.com/d/msgid/deeptools/CA35830D-C90B-472B-8DC3-0149BBCF62DA%40brown.edu.
Devon Ryan
Jan 7, 2020, 3:57:18 AM1/7/20
to Ashley Conard, deepTools
Have a look at the companion deepStats package, which can compute statistics between the curves: https://github.com/gtrichard/deepStats
Devon
--
Devon Ryan, Ph.D.
Email: dpr...@dpryan.com
Data Manager/Bioinformatician
Max Planck Institute of Immunobiology and Epigenetics
Stübeweg 51
Devon Ryan, Ph.D.
Email: dpr...@dpryan.com
Data Manager/Bioinformatician
Max Planck Institute of Immunobiology and Epigenetics
Stübeweg 51
79108 Freiburg
To view this discussion on the web visit https://groups.google.com/d/msgid/deeptools/6C6DADDA-BEF7-47EC-B3F5-958BEAD6763F%40brown.edu.
Devon Ryan
Jan 7, 2020, 3:57:18 AM1/7/20
to Ashley Conard, deepTools
If you want a log2 change then you can use bigwigCompare, but then you'll need something for the change to be relative to. For averaging replicates, you can use the wiggletools package, which can also do things like log2 transform the count data.
Devon
--
Devon Ryan, Ph.D.
Email: dpr...@dpryan.com
Data Manager/Bioinformatician
Max Planck Institute of Immunobiology and Epigenetics
Stübeweg 51
Devon Ryan, Ph.D.
Email: dpr...@dpryan.com
Data Manager/Bioinformatician
Max Planck Institute of Immunobiology and Epigenetics
Stübeweg 51
79108 Freiburg
To view this discussion on the web visit https://groups.google.com/d/msgid/deeptools/DCCB0F0B-43F8-451F-9902-F6BABA34BF6A%40brown.edu.
Reply all
Reply to author
Forward
0 new messages