Oracle Connector Metrics
138 views
Skip to first unread message

Chris Cranford
Mar 31, 2021, 1:55:15 PM3/31/21
to debe...@googlegroups.com
Hi All -
Recently the team was discussing a few of the Oracle connector's metrics and a few that stood out were TotalCapturedDmlCount, TotalProcessedRows, NumberOfCommittedTransactions, and NumberOfRolledBackTransactions. For those who are currently using the Oracle connector, could you take a moment and share these metrics with us? We'd like to get a better understanding in a real world environment (not just a test container) at the ratio of these values to see if there is the potential for any more performance tuning / improvements in this area.
Thanks & looking forward to the number crunches!
Chris

Martin Perez
Apr 14, 2021, 9:50:21 AM4/14/21
to debezium
Hi Chris,
Late reply but as embarrassing as it sounds I just discovered the google group. Anyways, here are some "live" numbers. As mentioned in other thread, this instance is an "integration" database but it is very busy as provides service to many different systems. We expect production deploy to be 10x bigger.
[2021-04-12 18:19:49,114] INFO Streaming metrics dump: OracleStreamingChangeEventSourceMetrics{currentScn=17423241693665, oldestScn=17423147499457, committedScn=17423241685359, offsetScn=17423147499455, logMinerQueryCount=29455, totalProcessedRows=41138417, totalCapturedDmlCount=33127479, totalDurationOfFetchingQuery=PT52H14M2.221339809S, lastCapturedDmlCount=1311, lastDurationOfFetchingQuery=PT8.506765002S, maxCapturedDmlCount=89459, maxDurationOfFetchingQuery=PT5M5.535145115S, totalBatchProcessingDuration=PT1H33M53.947S, lastBatchProcessingDuration=PT0.091S, maxBatchProcessingDuration=PT6M48.891S, maxBatchProcessingThroughput=30912, currentLogFileName=[Ljava.lang.String;@1be9b03b, minLogFilesMined=0, maxLogFilesMined=2, redoLogStatus=[Ljava.lang.String;@1f6ff911, switchCounter=170, batchSize=100000, millisecondToSleepBetweenMiningQuery=900, recordMiningHistory=false, hoursToKeepTransaction=0, networkConnectionProblemsCounter0, batchSizeDefault=100000, batchSizeMin=10000, batchSizeMax=1000000, sleepTimeDefault=200, sleepTimeMin=0, sleepTimeMax=1000, sleepTimeIncrement=100, totalParseTime=PT7M18.153S, totalStartLogMiningSessionDuration=PT2M7.909S, lastStartLogMiningSessionDuration=PT0.003S, maxStartLogMiningSessionDuration=PT0.164S, totalProcessTime=PT54H7M29.877S, minBatchProcessTime=PT0S, maxBatchProcessTime=PT0S, totalResultSetNextTime=PT33M23.667S, lagFromTheSource=DurationPT9.609S, maxLagFromTheSourceDuration=PT7M13.764S, minLagFromTheSourceDuration=PT0S, lastCommitDuration=PT0S, maxCommitDuration=PT6M48.705S, activeTransactions=20, rolledBackTransactions=27847, committedTransactions=2686354, abandonedTransactionIds=[], rolledbackTransactionIds=...., registeredDmlCount=33127479, committedDmlCount=32945464, errorCount=0, warningCount=1464, scnFreezeCount=48
Some observations.
- I see this connector was running for 60h but most of the time was on the weekend so kind of "light" activity.
- We don't have JMX turned on. We will turn it on sooner or later but it would be nice to dump the metric summary to the log lets say every hour for example.
- There are probably minor leaks in that metrics class with those Sets. Can tell as the previous log lines has 27K transaction ids
- In general in the log line I do miss the overall time that Debezium has run. I'm sure that is somewhere in JMX. DML metrics too, I recall adding this somewhere but I dont have the code in front of me right now.
Hope that helps.
Cheers,
Martín
Chris Cranford
Apr 14, 2021, 2:03:21 PM4/14/21
to debe...@googlegroups.com, Martin Perez
Hi Martin -
So this is quite interesting, from this dump we can conclude the following:
* 80.53% of the rows processed by the connector were Insert, Update or Delete operations
* One mining session query took a maximum of 5m 5.53s to return the results
* Largest batch processing iteration took 6m 48.891s
* Max Latency is 7m 13.764s
* Latest lag is 9.6s
* Starting of mining session is quite small overall, 2m 7.9s (you're obviously using online_catalog strategy)
You're using some pretty large batchSize values and some fairly small sleepTime values. I'm guessing due to the rather long fetch query durations and result-set-next values, the smaller sleepTimes are unimpactful because a vast majority of the connector's lifecycle is waiting on actually getting the data from the LogMiner view so it can be processed. What is your take on these times and the max latency of 7m? Is this reasonable? Oracle is quite different when it comes to processing the transaction logs unlike some other Debezium connectors, and so I'm just curious if the performance as you see seems acceptable for large deployments.
Thanks
Chris
--
You received this message because you are subscribed to the Google Groups "debezium" group.
To unsubscribe from this group and stop receiving emails from it, send an email to debezium+u...@googlegroups.com.
To view this discussion on the web visit https://groups.google.com/d/msgid/debezium/b35b7c30-c197-4b3f-b441-20818bf89ec7n%40googlegroups.com.

Milo van der Zee
Apr 14, 2021, 2:38:45 PM4/14/21
to debe...@googlegroups.com, Martin Perez
Hello,
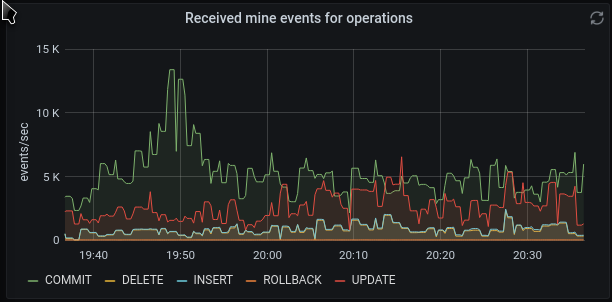
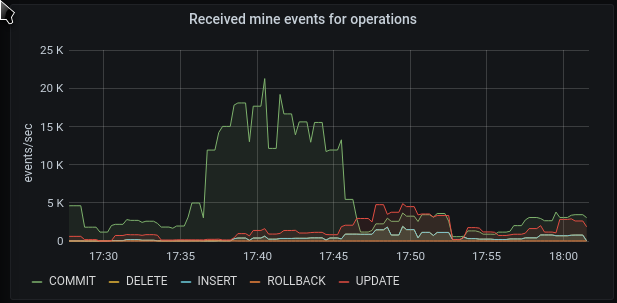
In my case the distribution between operations fluctuates very much. Mainly because there are are many tables and I only mine a couple.
MAG,
Milo
Op wo 14 apr. 2021 om 20:03 schreef Chris Cranford <cran...@gmail.com>:
To view this discussion on the web visit https://groups.google.com/d/msgid/debezium/65afa84c-4e4f-a1d9-bb3d-f599c0c076f7%40gmail.com.
Martin Perez
Apr 15, 2021, 5:23:05 AM4/15/21
to Chris Cranford, debe...@googlegroups.com
Thanks for the insights Chris.
Right, those delays are a big problem. Your analysis is great. The fact that it took 1m to process the rows is a very interesting data point. It hints there is a lot of data coming back from the DB, although on the other hand I do notice that our connector is not overriding max.queue.size which is obviously a problem, but it also means that we shouldn't be processing more than ~8K rows per log mining contents query. That shouldn't take a minute to process I believe 🤔 🤔
When we contributed the tuneable min/max sizing logic it was essentially to address large SCN jumps which we haven't identified yet, i.e. all of a sudden the SCN jumps so much ( have seen in the order of hundreds of millions ) that the connector would appear stuck for minutes or even hours. The strategy of using a "limit" query did seem to work but so did tuning the min/max SCN "between limits". But then we had to focus on other stuff. Now we plan to keep a closer eye to performance and see if we can figure out the large minute gaps.
In general, looking at any random time, the numbers are much better than what shown by the "max" metrics. Like for example I just looked right now at some of the debug log that we print and got this:
[2021-04-15 08:59:14,086] DEBUG 566 Rows, 354 DMLs, 71 Commits, 3 Rollbacks, 199 Inserts, 58 Updates, 97 Deletes. Processed in 26 millis. Lag:4070. Offset scn:17423255890717. Offset commit scn:17423390614614. Active transactions:58. Sleep time:1000 (io.debezium.connector.oracle.logminer.LogMinerQueryResultProcessor:253)
Which shows 4s latency and would be pretty acceptable for our use cases. However, the query only fetch 566 rows and I have no idea if that is really a good number from a Logminer operational perspective. More data from other users would be very helpful here.
Btw, totally unrelated and unsolicited comment, but it would be great for Debezium to use micrometer. Kind of tricky now that there are so many installations probably relying in the current JMX structure.
Best,
Martin
Reply all
Reply to author
Forward
0 new messages