
Sophia
is 2.611496,7.00?
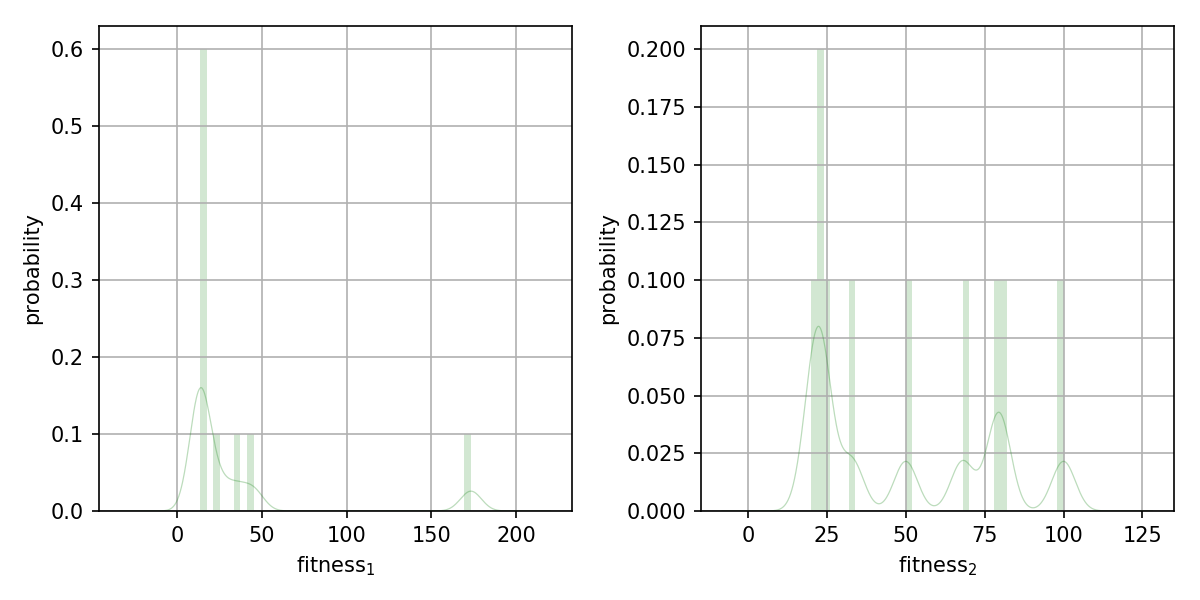
173.384071,100.0
45.082696,80.0
34.562327,79.0
24.557862,68.0
14.550288,50.0
13.726517,33.0
13.479549,24.0
13.439238,23.0
13.430936,22.0
13.409498,20.0
9.029356,19.0
7.88063,18.0
2.611496,7.00

Derek Tishler
Derek Tishler
from deap.benchmarks.tools import diversity, convergencehttps://github.com/DEAP/deap/blob/f6accf730555c5bbc1c50ac310250ad707353080/examples/ga/nsga2.py#L134
Sophia
| # with open("pareto_front/zdt1_front.json") as optimal_front_data: |
| # optimal_front = json.load(optimal_front_data) |
| # Use 500 of the 1000 points in the json file |
| # print("Convergence: ", convergence(pop, optimal_front)) |
| # print("Diversity: ", diversity(pop, optimal_front[0], optimal_front[-1])) |
Derek Tishler
hof = tools.ParetoFront()ParetoFront docs:
Derek Tishler
https://www.iitk.ac.in/kangal/Deb_NSGA-II.pdf
Sophia White
Sorry missed what you meant, without the optimal front a benchmarking version of diversity may not be what you are looking for. If you could clarify what you need for a diversity measure, for example I found one here on page 188, right column for the Diversity Metric Del which may be able to use just the paretofront you have:
https://www.iitk.ac.in/kangal/Deb_NSGA-II.pdf
--
You received this message because you are subscribed to the Google Groups "deap-users" group.
To unsubscribe from this group and stop receiving emails from it, send an email to deap-users+...@googlegroups.com.
To view this discussion on the web visit https://groups.google.com/d/msgid/deap-users/7088080d-965c-4a0f-842c-fca31cef7e49%40googlegroups.com.
Derek Tishler

Sophia White
--
You received this message because you are subscribed to the Google Groups "deap-users" group.
To unsubscribe from this group and stop receiving emails from it, send an email to deap-users+...@googlegroups.com.
To view this discussion on the web visit https://groups.google.com/d/msgid/deap-users/defa3c2c-9a44-4d40-981c-faceff13413a%40googlegroups.com.
Derek Tishler
I updated my example code, after matching the figure's labels to the whitepaper figure I noticed some mistakes:
