rarefaction in vegan
2,416 views
Skip to first unread message

Mary Clapp
Aug 19, 2018, 9:55:24 PM8/19/18
to Davis R Users' Group
Hi friends,
Basically, I have a dataset that consists of 98 10-min audio samples taken at 10 different lakesides. For each clip, I manually identified every sound present. I filtered the results to bird species only, so each sample represents a 10-minute auditory survey of the avian community. I have 2 community matrices: one that is populated by the number of calls per species, and another that I've coerced to incidence only (0/1) data. It's a lil sketchy to use the call# data (because it doesn't reaaaaally reliably mean anything about abundance), but I included it anyway.
I also have a corresponding environmental matrix that describes some relevant covariates (elevation, treatment/control, etc).
I'm new to vegan/community analyses, and could use some help with making rarefaction curves.
Basically, I have a dataset that consists of 98 10-min audio samples taken at 10 different lakesides. For each clip, I manually identified every sound present. I filtered the results to bird species only, so each sample represents a 10-minute auditory survey of the avian community. I have 2 community matrices: one that is populated by the number of calls per species, and another that I've coerced to incidence only (0/1) data. It's a lil sketchy to use the call# data (because it doesn't reaaaaally reliably mean anything about abundance), but I included it anyway.
I also have a corresponding environmental matrix that describes some relevant covariates (elevation, treatment/control, etc).
Comm = the community matrix with call #
pa = the community matrix with cells coerced to presence/absence (1/0)
Comm.env = corresponding environmental covariates
I made species accumulation curves, which indicate to me that the number of samples per lake I took isn't enough to describe the entire community actually present at each lake.
Furthermore, my sample size (# of audio recordings) varies by lake, so
I'd like to make some rarefaction curves so that I can report rarefied species richness for each lake (rarefied to the lake with the smallest # of surveys (7)).
I think in order to do this, I'll need to subset my matrix by lake, and calculate a separate curve for each (?). But first, I just wanted to see if I could make one on the entire dataset.
> S <- specnumber(pa) # observed number of species
> (raremax <- min(rowSums(pa)))
[1] 1
> Srare <- rarefy(pa, 1) # rarefied number of species
> rarecurve(pa, step = 1, sample = raremax, col = divmatrix.env$fish, cex = 0.6)
Error in approx(x = attr(z, "Subsample"), y = z, xout = sample, rule = 1) :
need at least two non-NA values to interpolate
>
Could it be that the couple of recordings that have only 1 species present is screwing this up somehow?
I've attached the two matrices and the relevant code.
Any help very much appreciated! Thanks, D-RUG!
More on the study design:
- The 10 lakes are in pairs of "fish-containing" and "fishless", each pair is nested within a unique basin. So, 5 basins, 10 lakes, 1 "treatment" (fish-containing) and 1 control (fishless).
- Lakes vary in elevation and size. Those data reside in divmatrix.env
- A few of the recordings are VERY sparse in vocal activity, with only 1 species calling.
- This is a random sample of recordings from a much larger dataset; these recordings were taken in a 5-day period in late breeding season (8-12 July 2015).

Evan Batzer
Aug 20, 2018, 2:54:05 PM8/20/18
to davi...@googlegroups.com
Hi Mary,
I think you're correct that a "raremax" value of 1 is returning a strange result for your rarefaction curves - the rarefy() and rarecurve() functions in vegan conduct individual-based rarefaction, so if you specify a raremax value of 1, you will only ever get a single species. As an aside, if you're not sure about individual abundances, I think you may want to stick with sample-based rarefaction (specaccum()), which it looks like you were using beforehand.
If I understand your study design correctly, I agree that you need aggregate your data by lakes so that each row contains the sum of all the individual counts for that site. To run the rarefy() function for the entire dataset, you can sum your species counts and run the code as before - the rarecurve function operates on a single row of a matrix.
# Aggregating dataset
comm_agg = colSums(pa) # summing species counts by column
S <- specnumber(comm_agg) # observed number of species
raremax = 20 # number of individuals to use in rarefaction
# Plotting rarefied species number
Srare <- rarefy(comm_agg, raremax) # rarefied number of species
plot(S, Srare, xlab = "Observed No. of Species", ylab = "Rarefied No. of Species")
abline(0, 1)
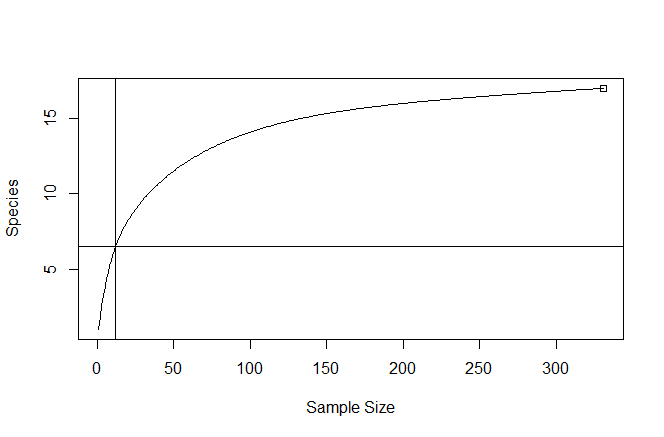
# Plotting rarefaction curve
rarecurve(matrix(comm_agg, nrow = 1), step = 1, sample = raremax, cex = 0.6)
I get this as the output:
I've also attached code to do the same for site-level rarefaction.
Hope this helps!
-Evan
PhD Student, Eviner Lab
University of California, Davis--
Check out our R resources at http://d-rug.github.io/
---
You received this message because you are subscribed to the Google Groups "Davis R Users' Group" group.
To unsubscribe from this group and stop receiving emails from it, send an email to davis-rug+...@googlegroups.com.
Visit this group at https://groups.google.com/group/davis-rug.
For more options, visit https://groups.google.com/d/optout.
Reply all
Reply to author
Forward
0 new messages