No work session tomorrow...
8 views
Skip to first unread message

Ryan Peek
Jan 15, 2018, 1:06:35 AM1/15/18
to davi...@googlegroups.com
Hi Folks,
--
No work session as it's Martin Luther King Jr. Day tomorrow (a holiday). We'll reconvene next week at the DSI.
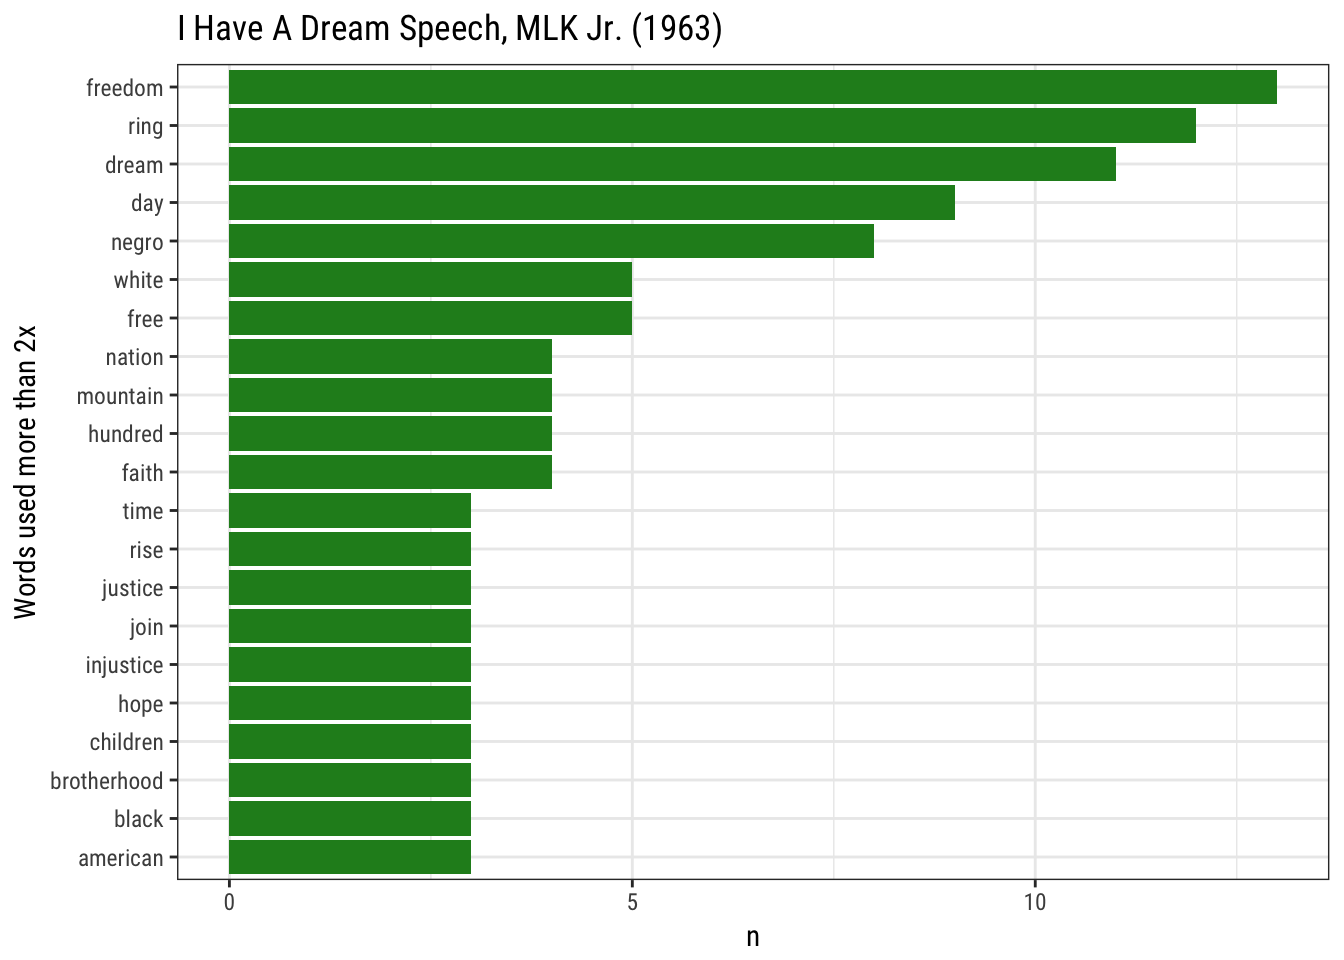
In honor of the holiday (and speeches lacking profanity), here's a figure showing the most commonly used words in MLK's "I Have a Dream" speech (and some code below).
Adios,
Ryan
suppressPackageStartupMessages({
  library(readr);
  library(ggplot2)
})

# read in the data (same as you would a csv)
mlk<-read_lines("https://raw.githubusercontent.com/gge-ucd/R-DAVIS/master/data/I_have_a_dream_1963.md")

# this splits the chunk of text into lines
mlk_text <- data_frame(line = 1:length(mlk), text = mlk)

# filter blank lines (even rows)
mlk_text <- mlk_text %>% filter(line %% 2 == 1) %>%
  mutate(line = 1:nrow(.)) # renumber lines

# Make single word vector
mlk_text<- mlk_text %>%
  unnest_tokens(word, text)

# Now remove all the stop words using an "anti_join"
tidy_mlk <- mlk_text %>%
  anti_join(stop_words)
# count use and then plot by most to least for words used more than twice in the speech
tidy_mlk %>%
count(word, sort = TRUE) %>%
filter(n > 2) %>%
mutate(word = reorder(word, n)) %>%
ggplot(aes(word, n)) +
geom_bar(stat = "identity", fill="forestgreen") +
xlab(NULL) +
theme_bw(base_family = "Roboto Condensed") +
coord_flip() + labs(x="Words used more than 2x", title="I Have A Dream Speech, MLK Jr. (1963)")"When we try to pick out anything by itself, we find it hitched to everything else in the universe."
John Muir (My First Summer in the Sierra, 1911)
-----------------------------------------------------John Muir (My First Summer in the Sierra, 1911)
Ryan Peek
PhD Candidate, Graduate Group in Ecology
Center for Watershed Sciences, UC Davis
@riverpeek


-----------------------------------------------------
Reply all
Reply to author
Forward
0 new messages