Average of technical replicates on plate

Chiara Duijser
Hi everyone,
Is it possible to take the average or sum of the technical replicates in a genlight object? I read that DArT run 30% of the samples you provide them as technical replicates, but on the plate I also had 2 samples per individual.
My metadata file looks like this (this is just part of my data):
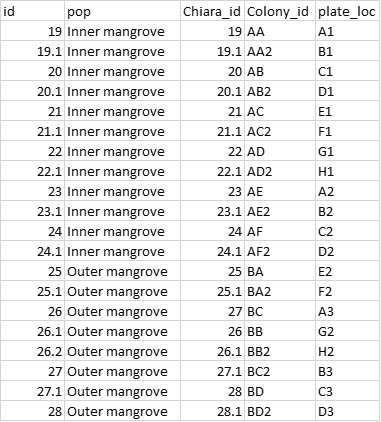
I want to take the average of Chiara_id 19 and 19.1, of 20 and 20.1 etc. as these are technical replicates and belong to one sample. Is there a function in dartR to do this?
Thanks for helping!
Chiara

Bernd.Gruber
Hi Chiara,
At the moment there is no function to do so.
One question is also which of the two replicates do you want to use in terms of genotype.
E.g. could be sensible to check the mismatches between samples, or use the one with the less missing data.
I have done a similar analysis in terms of missing data (because we had samples from the same individuals using different tissues (feathers and muscle) and wanted to check how good the extraction worked based on feathers. Good news they are as good and sometimes even better. So I selected the sample that had less missing data (not attempting to complement but would be possible.
If you were talking about the metadata then you could easily do some R to average between two rows.
You can create a factor that has the two first letter of Colony_ID and then use tapply or tidyverse and summarise
Hope that helps,
Bernd
==============================================================================
Dr Bernd Gruber )/_
_.--..---"-,--c_
Professor Ecological Modelling \|..' ._O__)_
Tel: (02) 6206 3804 ,=. _.+ _ \..--( /
Fax: (02) 6201 2328 \\.-''_.-' \ ( \_
Institute for Applied Ecology `''' `\__ /\
Faculty of Science and Technology ')
University of Canberra ACT 2601 AUSTRALIA
Email: bernd....@canberra.edu.au
WWW: bernd-gruber
Australian Government Higher Education Provider Number CRICOS #00212K
NOTICE & DISCLAIMER: This email and any files transmitted with it may contain
confidential or copyright material and are for the attention of the addressee
only. If you have received this email in error please notify us by email
reply and delete it from your system. The University of Canberra accepts
no liability for any damage caused by any virus transmitted by this email.
==============================================================================
--
You received this message because you are subscribed to the Google Groups "dartR" group.
To unsubscribe from this group and stop receiving emails from it, send an email to
dartr+un...@googlegroups.com.
To view this discussion on the web visit
https://groups.google.com/d/msgid/dartr/9332f5d1-5c66-4a80-96ed-e7ea6a6a0f56n%40googlegroups.com.
Chiara Duijser
Dear Bernd,
Thank you for your reaction and suggestions to check for mismatches between samples or use of less missing data. I am new to using the dartR package and am not a 100% sure how to analyze for mismatches or missing data.
If I want to check which of the two technical replicates (in my Colony_id or Chiara_id) has less missing data than the other, how could I check for this? For instance, if I check my dartR object using "gl" I can see the number of SNPs and percentage of missing data but it doesn’t tell me where/in which individuals this missing data is found. Could you perhaps share some of the code you used to check for your analysis on feathers and muscle if that's possible?
Thank you very much for your help!
Chiara
Bernd.Gruber
Hi Chiara,
Not sure how fluent your R is. Here is the code I used for cassowaries.
I had the definition in the individual names e.g.
19t and 19f (was the same individual 19, but one was from feather and the other was from tissue).
So the first command sorts the genlight object by this name (19t, 19f, 20t, 20f) etc.
Then I created a factor of individuals (19, 20 etc). (ugr)
In the for loop I take the two individuals which are the same (i1, i2) and then calculate the missing values for each (b1, b2) and create a take vector which to take and finally take the individual I wanted by the final line of code.
##############################################################
#take best (either feather or tissue)
casso3 <- casso[order(indNames(casso)),]
gr <- substr(indNames(casso3), 1,nchar(indNames(casso3))-1)
ugr <- unique(gr)
take <- NULL
for (i in 1:length(ugr))
{
i1 <- which(indNames(casso3)==paste0(ugr[i],"f"))
i2 <- which(indNames(casso3)==paste0(ugr[i],"t"))
if (length(i1)>0 & length(i2)>0) {
#take the better on
b1 <- sum(!is.na(as.matrix(casso)[i1,]))
b2 <- sum(!is.na(as.matrix(casso)[i2,]))
if (b1>b2) take[i]<- i1 else take[i]<- i2 } else {
if (length(i1)>0) take[i] <- i1 else if (length(i2)) take[i] <- i2 }
}
casso_best <- casso3[take,]
table(substr(indNames(casso_best),3,3))
# f t
# 36 20
I have some more code, but a simple and nice way to compare two individuals and their genotypes is using a “confusion” matrix
Elg.
> tt<- table(as.matrix(gl[1,]), as.matrix(gl[2,]), useNA = "always")
>tt
0 1 2 <NA>
0 361 141 45 0
1 106 96 28 0
2 75 58 31 2
<NA> 27 18 11 1
Creates the table and you can see the mismatches by everything that is off the diagonal. This shows you basically how well they compare. So you can use the loop above also to compare by individual and for example calculate the percentage correct (sum(diag(tt))/sum(tt)
Hope that makes sense,
Cheers, Bernd
To view this discussion on the web visit https://groups.google.com/d/msgid/dartr/5335bcdb-87cb-409e-9b4c-e89388309c5fn%40googlegroups.com.

Jose Luis Mijangos
# test dataset
t1 <- platypus.gl
# reporting missing data by individual
gl.report.callrate(t1,method = "ind")
# defining individuals to drop
ind_list <- c("T26","T5")
# droping individuals
t2 <- gl.drop.ind(t1,ind.list = ind_list)