IIP Jun-14 (Are consumers shying away from markets ???)
1 view
Skip to first unread message

Sandeep Tulsian
Aug 13, 2014, 10:55:14 AM8/13/14
to quants....@hotmail.com
IIP Jun-14 (Are consumers shying away from markets ???)
- IIP for Jun-14 came at 3.4%, which does not indicate healthy recovery in growth momentum of Indian Economy, which most of us believe that is on its way.
- I personally believe that, If we see IIP growth of more than 5% consequently for few months, we can say that our economy’s growth engine has finally started once again.
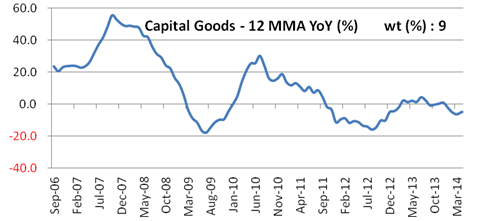
- Consumer goods segment is this month’s dragger. At the same time Capital goods segment posted impressive growth of 23%.
- To get rid of seasonality impact, low / high base effect and such other issues, I prefer to look at 12 Month Moving Average (12MMA) YoY growth, where we can more easily analyze the trend.
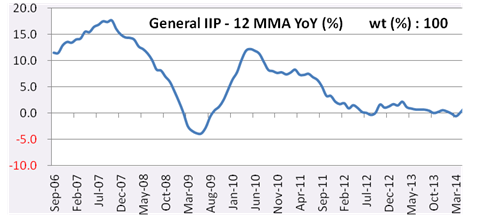
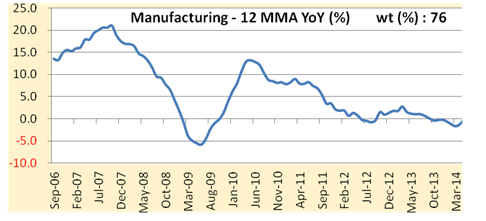
- Accordingly one may conclude that, i) Manufacturing activities (accounts 76% of IIP) haven’t kicked. ii) Its only because of Mining and Electricity that General IIP (12MMA) growth is 1.6%. iii) Consumer goods, which accounts for 30% of IIP has 12 MMA growth of -3.1%, corresponding number for Jun-13 works out to be -0.13%. Are consumers shying away from markets ???
To enable you to dissect more on this, I have placed an Excel “IIP_and_its_constitutents_(Series 2004-05)” which you can use.
| IIP and its Break-down across various categories (Monthly) | ||||||||
| YoY Growth (%) for the month | ||||||||
| Category | Weight (%) | Jun-14 | May-14 | Jun-13 | ||||
| 1 | Manufacturing | 75.5 | 1.8 | 5.1 | -1.7 | |||
| 2 | Mining & Quarrying | 14.2 | 4.3 | 2.9 | -4.6 | |||
| 3 | Electricity | 10.3 | 15.7 | 6.7 | 0.0 | |||
| General IIP | 100.0 | 3.4 | 5.0 | -1.8 | ||||
| Use based Categories | ||||||||
| 1 | Basic Goods | 45.7 | 9.0 | 6.4 | -1.9 | |||
| 2 | Capital Goods | 8.8 | 23.0 | 4.3 | -6.6 | |||
| 3 | Intermediate Goods | 15.7 | 2.7 | 3.2 | 1.3 | |||
| 4 | Consumer Goods | 29.8 | -10.0 | 4.2 | -1.5 | |||
| 4.1 | Consumer Durables | 8.5 | -23.4 | 3.4 | -10.1 | |||
| 4.2 | Consumer Non-durables | 21.4 | 0.1 | 4.8 | 6.2 | |||
| 12 Month Moving Average (MMA) | ||||||||
| YoY Growth (%) for 12 MMA | ||||||||
| Category | Weight (%) | Jun-14 | May-14 | Jun-13 | ||||
| 1 | Manufacturing | 75.5 | 0.6 | 0.1 | 1.1 | |||
| 2 | Mining & Quarrying | 14.2 | 2.5 | 2.2 | -4.2 | |||
| 3 | Electricity | 10.3 | 9.5 | 8.1 | 2.9 | |||
| General IIP | 100.0 | 1.6 | 1.1 | 0.7 | ||||
| Use based Categories | ||||||||
| 1 | Basic Goods | 45.7 | 5.7 | 4.7 | 0.8 | |||
| 2 | Capital Goods | 8.8 | -0.6 | -4.3 | 1.5 | |||
| 3 | Intermediate Goods | 15.7 | 3.1 | 3.5 | 1.6 | |||
| 4 | Consumer Goods | 29.8 | -3.1 | -2.3 | -0.2 | |||
| 4.1 | Consumer Durables | 8.5 | -9.8 | -8.7 | -7.8 | |||
| 4.2 | Consumer Non-durables | 21.4 | 1.7 | 2.1 | 6.0 | |||
Key Charts

Reply all
Reply to author
Forward
0 new messages