Multi-line chart with date/time x-axis.
1,099 views
Skip to first unread message

Nigel Legg
Dec 19, 2015, 5:45:31 AM12/19/15
to d3...@googlegroups.com
Hello, I have a multiline chart using data from a few months ago: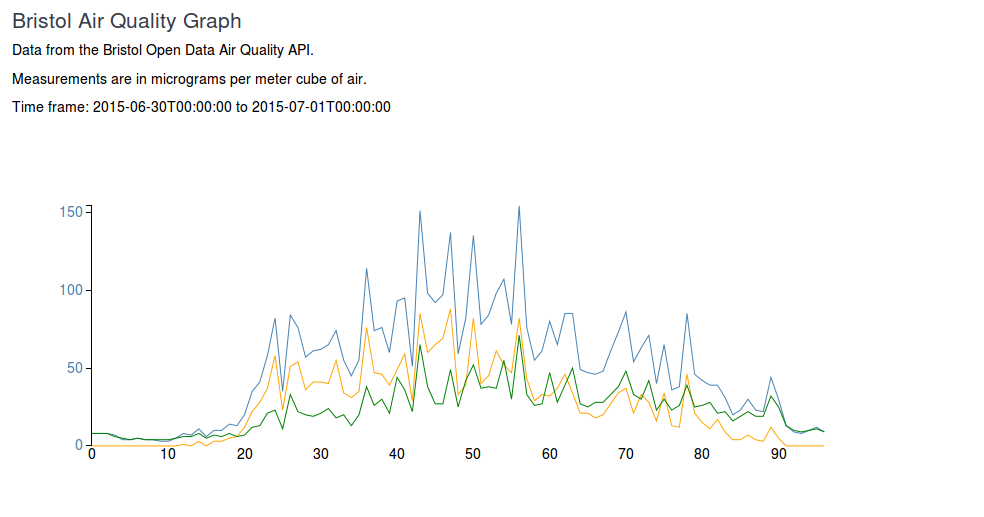
I wanted to change the x-axiss labels to date/time - each data point comes in on the quarter hour (00:00, 00:15, 00:30, 00:45, etc) continuously. The chart is refreshed by refreshing the page. The data for a single point is in the following structure: {'level': 82.0, 'location': 'rupert st ', 'pollutant': u'no', 'datetime': '19/12/2015 08:45'}

Cheers, Nigel
mobile 07758 665575
skype: nigellegg

Curran
Dec 20, 2015, 10:46:12 PM12/20/15
to d3-js
Hello Nigel,
Here's an example that might help: Multi-Line Chart of Largest Countries. You may want to check your code to see if you are using a time scale for X and parsing dates. From the axes in your screenshot, it looks like the X axis might be using an ordinal scale rather than a time scale.
Here's how to set up a time scale for X:
var xScale = d3.time.scale().range([0, innerWidth]);
Also, you'll need to parse dates from the data:
      function type(d){
        d.year = new Date(d.year);
        //... other columns
        return d;
      }

      d3.csv("populationByCountryByYear.csv", type, render);
Best regards,
Curran
Nigel Legg
Dec 21, 2015, 2:33:48 AM12/21/15
to d3...@googlegroups.com
Thanks, will take a look.
Cheers, Nigel
mobile 07758 665575
skype: nigellegg
--
You received this message because you are subscribed to the Google Groups "d3-js" group.
To unsubscribe from this group and stop receiving emails from it, send an email to d3-js+un...@googlegroups.com.
For more options, visit https://groups.google.com/d/optout.
Nigel Legg
Dec 21, 2015, 3:08:53 AM12/21/15
to d3...@googlegroups.com
This is my code for the chart (data comes from a python/ Django site in json, formatted as in previous mail.)
<script>
var marginleft = 80;
var marginright = 80;
var margintop = 80;
var marginbottom = 80;
var width = 900;
var height = 400;
var data = {{data|safe}};
var timeFormat = d3.time.format('%d/%m/%Y %H:%M:%S');
var mindate = timeFormat.parse(data[0]['datetime'])
maxdate = timeFormat.parse(data[data.length-1]['datetime']);
var x = d3.time.scale()
.domain([mindate, maxdate])
.rangeRound([0, width - marginleft - marginright]);
var y1 = d3.scale.linear()
.domain([0, d3.max(data, function(d) { return d.nox; })])
.range([height - margintop - marginbottom, 0]);
var y2 = d3.scale.linear()
.domain([0, d3.max(data, function(d) { return d.no; })])
.range([height - margintop - marginbottom, 0]);
var y3 = d3.scale.linear()
.domain([0, d3.max(data, function(d) { return d.no2; })])
.range([height - margintop - marginbottom, 0]);
var xAxis = d3.svg.axis()
.scale(x)
.orient('bottom')
//.ticks(d3.time.hours, 1)
.tickFormat(d3.time.format('%d/%m/%Y %H:%M'))
.tickSize(0)
.tickPadding(8);
var line1 = d3.svg.line()
.x(function(d, i) { return x(i); })
.y(function(d) { return y1(d); });
var line2 = d3.svg.line()
.x(function(d, i) { return x(i); })
.y(function(d) { return y2(d); });
var line3 = d3.svg.line()
.x(function(d, i) { return x(i); })
.y(function(d) { return y3(d); });
var graph = d3.select("#airqualchart").append("svg:svg")
.attr("width", width + marginleft + marginright)
.attr("height", height + margintop + marginbottom)
.append("svg:g")
.attr("transform", "translate(" + margintop + "," + marginleft + ")");
graph.append("svg:g")
.attr("class", "x axis")
.attr("transform", "translate(0," + (height-marginbottom) + ")")
.call(xAxis);
var yAxisLeft = d3.svg.axis().scale(y1).ticks(4).orient("left");
graph.append("svg:g")
.attr("class", "y axis axisLeft")
.attr("transform", "translate(0, 0)")
.call(yAxisLeft);
graph.append("svg:path")
.attr("d", line1(y1))
.attr("class", "y1");
graph.append("svg:path")
.attr("d", line2(y2))
.attr("class", "y2");
graph.append("svg:path")
.attr("d", line3(y3))
.attr("class", "y3");
</script>
Cheers, Nigel
mobile 07758 665575
skype: nigellegg
Nigel Legg
Dec 21, 2015, 5:48:40 AM12/21/15
to d3...@googlegroups.com
This was old code. My mistake.
Cheers, Nigel
mobile 07758 665575
skype: nigellegg
Reply all
Reply to author
Forward
0 new messages