No tooltip when Hover the mouse over multiline chart
16 views
Skip to first unread message

Vaibhav Kumar
Jun 13, 2018, 2:55:51 PM6/13/18
to d3...@googlegroups.com
Hi,
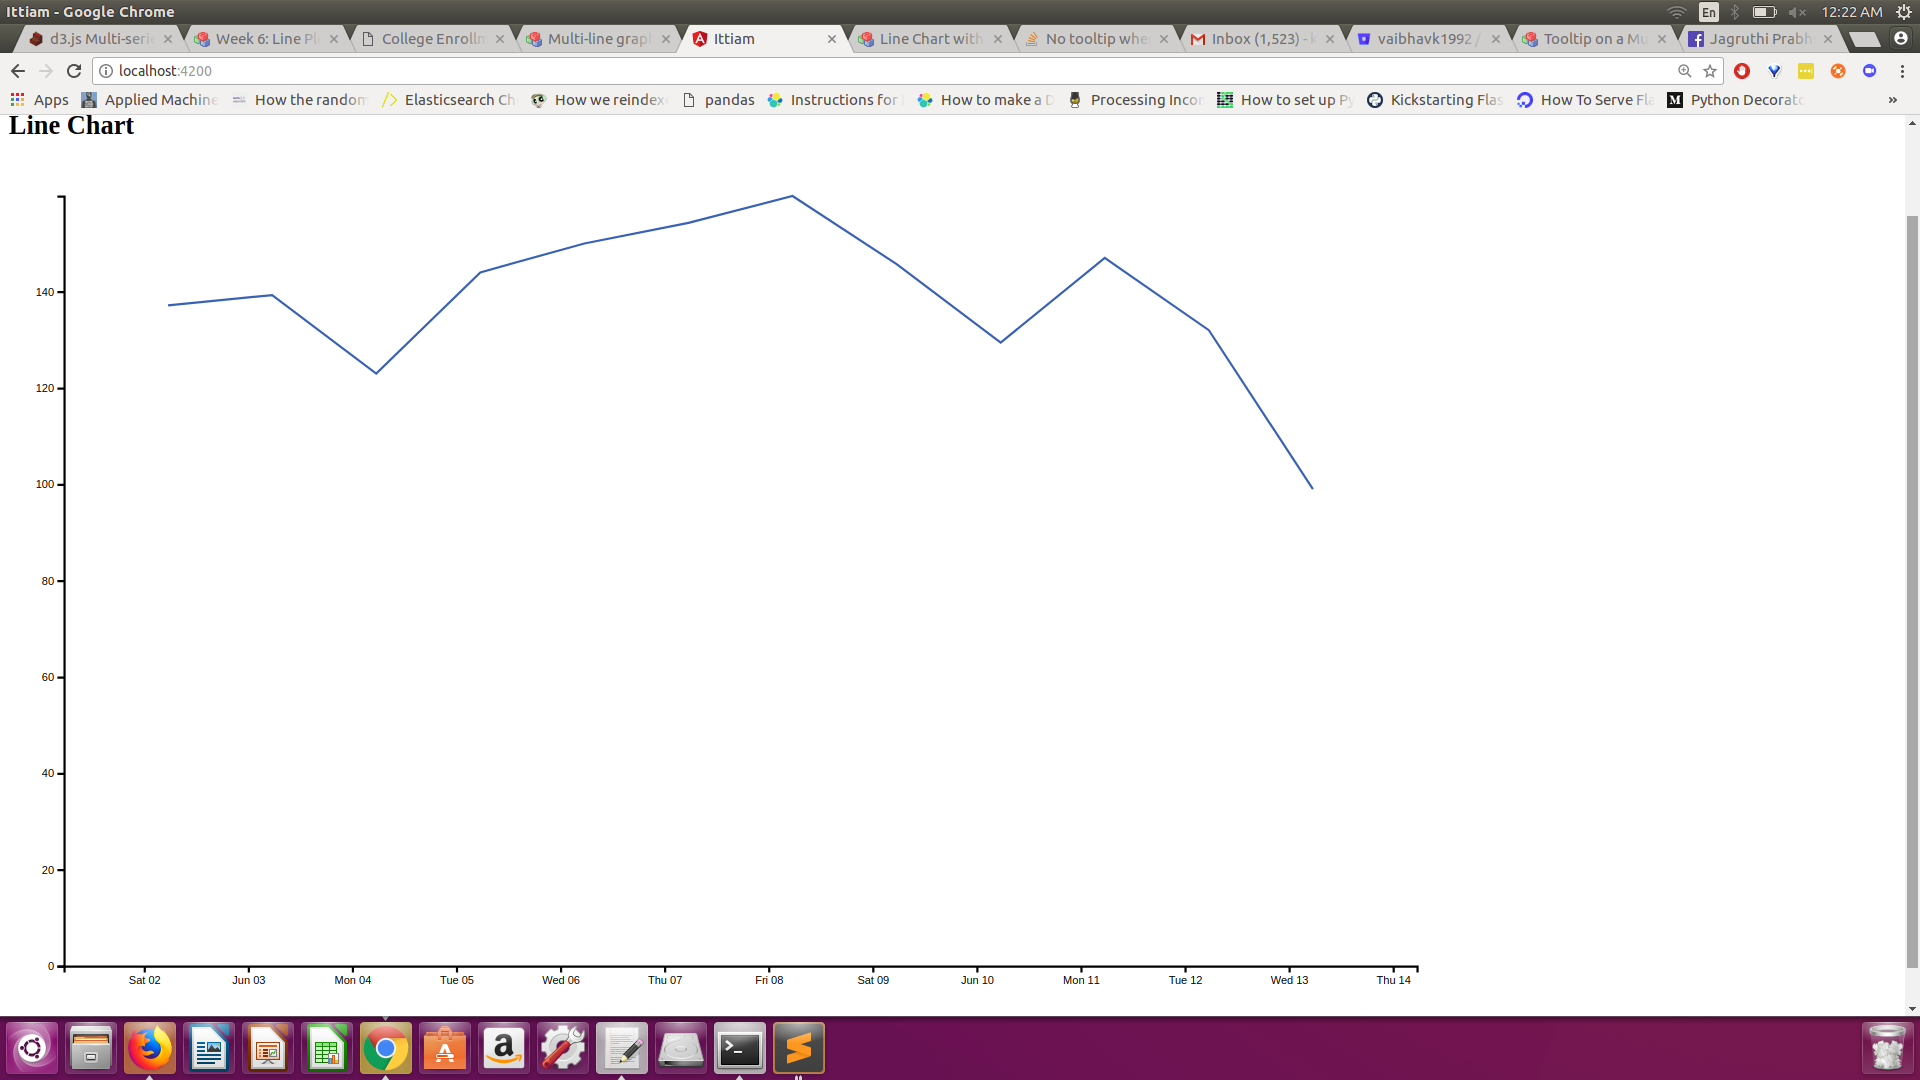
I'm using d3 as my charting library and after the graph plot as i hover my mouse i can't see any values at the datapoint but in the HTML console i can see event is getting triggered.
I want to see date and value when i hover but i'm not getting any idea how to proced with it as i'm very new to d3.
below is the small snippet i coded :
dataNest.forEach(function (d, i) {
svgVar.selectAll("path")
.data(dataNest)
.enter()
.append("path")
.attr("class", "line")
.style("stroke", function () { // Add the colours dynamically
return d.color = color(d.key);})
.on("mouseover", tooltip)
.attr("d", function(d) { return pricelineVar(d.values); })
.attr("fill","none");
function tooltip(d,i)
{
svgVar.style("left", d3.event.pageX + "px")
.style("top", d3.event.pageY + "px")
.style("display", "inline-block")
.html(" x:"+ d.date );
}
If anyone wants to give any suggestion i can paste the full code as well

Chris Viau
Jun 14, 2018, 9:17:15 AM6/14/18
to d3-js
I'm not sure what selection is in svgVar, but I find it suspicious that you would set its .html content, as it's the same selection that you use to build your line path.
Also, I would expect a tooltip to be position:absolute to show up at the right place. Do you see the tooltip in the DOM when using Chrome Element tab of Developer tools?
Reply all
Reply to author
Forward
0 new messages