Last step connecting MySQL to PHP to JSON to D3 (javascript) cool stuff multicharts

jan öberg
Hi there!
Link to download it! example.zip (on the "advanced_8stremas, i took the original and put some steroids, so It can be easyer for you to get where is the problem!)
Demo live: Advanced graph on steroids
Demo live: Advanced graph Original
Demo live: Simple graph takes values directly from mysql 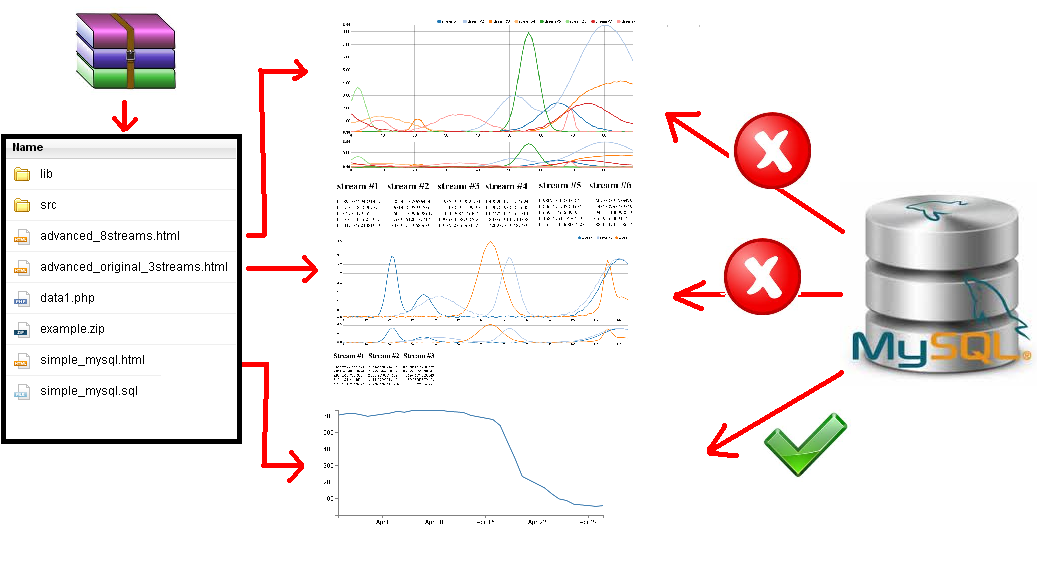
So the answer relays on the PINK box! xP
This is the code that generates the random data for the advanced graph!
function CAGARRO() {
  var data1 = [];
  var data2 = [];
  var data3 = [];
  var data4 = [];
  var data5 = [];
  var data6 = [];
  var data7 = [];
  var data8 = [];

// number 8 means 8lines, number 130 means create 130 x values,
// .1 means the minimum Y value that the random code can give to all his numbers
stream_layers(8,130,.1).map(function(layer, PIXARADA) {
      layer.forEach(function(TUTANCAMON, i) {
          var object = { x: TUTANCAMON.x };
          object['stream' + (PIXARADA + 1)] = TUTANCAMON.y;
          eval('data' + (PIXARADA + 1)).push(object);
      });
});


var dataA = extend(data1, data2);
var dataB = extend(data3, data4);
var dataC = extend(data5, data6);
var dataD = extend(data7, data8);

var dataY = extend(dataA, dataB);
var dataZ = extend(dataC, dataD);

var RESULTATS = extend(dataY, dataZ);


return RESULTATS;
}
This tutorial is amazing, you can't imagine how simple is to connect your MySQL database to a D3 (javascript) chart. (15min implementation)
The only "problem" is that the chart on the tutorial is "to simple". Just one single line!

Then we have "really cool stuff" like here: Live Demo of the CoolStuff Chart
and here: Original Source CoolStuff Chart

And when you arrive happy to this point you find following differences: - The tutorial source:
d3.json("php/data2.php", function(error, data) {
data.forEach(function(d) {
    d.date = parseDate(d.date);
    d.close = +d.close;
});
This tutorial source means the data that is recibing from the MySQL database somethink like this:
[{"date":"1-May-12","close":"58.13"},{"date":"30-Apr-12","close":"53.98"},
{"date":"27-Apr-12","close":"67.00"},{"date":"26-Apr-12","close":"89.70"},
{"date":"25-Apr-12","close":"99.00"},{"date":"24-Apr-12","close":"130.28"},
{"date":"23-Apr-12","close":"166.70"},{"date":"20-Apr-12","close":"234.98"},
{"date":"19-Apr-12","close":"345.44"},{"date":"18-Apr-12","close":"443.34"},
{"date":"17-Apr-12","close":"543.70"},{"date":"16-Apr-12","close":"580.13"},
{"date":"13-Apr-12","close":"605.23"},{"date":"12-Apr-12","close":"622.77"},
{"date":"11-Apr-12","close":"626.20"},{"date":"10-Apr-12","close":"628.44"},
{"date":"9-Apr-12","close":"636.23"},{"date":"5-Apr-12","close":"633.68"},
{"date":"4-Apr-12","close":"624.31"},{"date":"3-Apr-12","close":"629.32"},
{"date":"2-Apr-12","close":"618.63"},{"date":"30-Mar-12","close":"599.55"},
{"date":"29-Mar-12","close":"609.86"},{"date":"28-Mar-12","close":"617.62"},
{"date":"27-Mar-12","close":"614.48"},{"date":"26-Mar-12","close":"606.98"}]
This uggly data looks like this on the MySQL:

Anyway and the super CoolStuff CHART all the data is created with some strange random numbers loop that is being a hell for me to try to pluggin the data I recibe from MySQL to the coolStuff code!!
Here a copy of the "CoolStuff" loop:
function testData() {
  var data1 = [];
  var data2 = [];
  var data3 = [];

  stream_layers(3,128,.1).map(function(layer, index) {
    layer.forEach(function(item, i) {
      var object = { x: item.x };
      object['stream' + (index + 1)] = item.y;
      eval('data' + (index + 1)).push(object);
    });
  });
Any Ideas?
