d3 gauge chart with labels and percentages
490 views
Skip to first unread message

Neil
Apr 11, 2019, 12:53:00 AM4/11/19
to d3-js
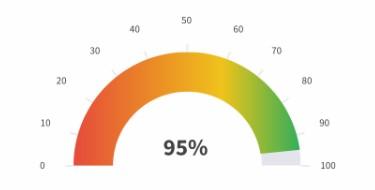
I am searching for a gauge chart that looks like the following. What's most interesting about this chart is that the color changes depending on the percentage value of the chart. It also have ticks with labels outside the chart indicating the value range. I've been searching for about three days now and I haven't found anything that uses the d3.js library.
I somehow found these two gauge charts, one from here and the other from here, but neither have the label as clear and the changing-color gradient fill on chart.
Any help is appreciated.
Thanks.
Reply all
Reply to author
Forward
0 new messages