Getting D3 Show Reel working in JSFiddle

Seth F

Chris Viau
--
You received this message because you are subscribed to the Google Groups "d3-js" group.
To unsubscribe from this group and stop receiving emails from it, send an email to d3-js+un...@googlegroups.com.
For more options, visit https://groups.google.com/groups/opt_out.

Mike Bostock
The show reel exists to demonstrate different transitions that you can
implement with D3. That’s it. You should not use the show reel to
visualize your own data. The show reel itself is a horrible
visualization, missing proper axes and labels, and some of the
transitions don’t make much sense. For example, when converting
stacked bars to bars, the bars correspond to average stock price,
which is pretty meaningless.
The show reel still serves its purpose at demonstrating the breadth of
transitions that are possible in D3 as a framework, so I don't regret
making it. But please do NOT use it as an example, either to learn
from (it’s too complicated) or for real data (it’s not intended for
that).
Or do whatever you want, but I’m not helping, and you have been warned. :)
Mike
Seth F

Simon Russell
Mike Bostock
> chart into a series of bar charts.
(which is also a bit fancier than may be necessary):
http://bl.ocks.org/3943967
I think you might have better luck with these two examples, which are
more intended to be used as starting points for real visualizations:
* http://bl.ocks.org/3887051 - grouped bar
* http://bl.ocks.org/3886208 - stacked bar
The structure of the two charts is fairly similar so I expect with a
little tinkering you could transition between them.
Mike
Chris Viau
Mike
Seth F
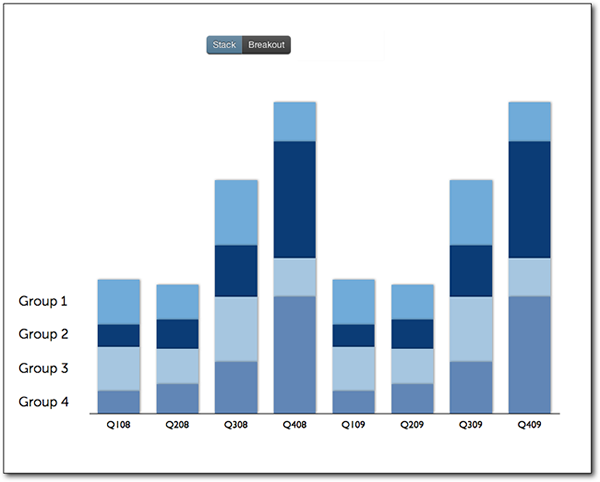
2. Clicking a button "breaks out" the stacked bar chart into 4 different standalone bar charts:

I tried modifying the code on http://bl.ocks.org/3943967 to make that happen, but I couldn't figure out how to set the y-coordinates to effectively "fake" 4 individual bar charts (it also wasn't clear how to add three more axes to a modified stacked bar chart). But now it seems like I should just set up a single stacked bar chart plus 4 regular bar charts, and transition from one to the other.
Can anyone provide guidance on how to do that transition? I'd love to have the feel of the transition in http://bl.ocks.org/3943967 or in the demo reel--which is what got me interested in building off of that in the first place.
Looking forward to your thoughts, and thanks again to this community for being so incredibly helpful and responsive!
Cheers,
Seth
Mike Bostock
http://bl.ocks.org/4679202
I originally repeated the axes when using multiples, but that feels
redundant, so I removed them. Anyway, if you still want the axes, you
could add an opacity transition on the axes to fade them in and out.
Mike
Seth Familian
With gratitude,
Seth