How to size and color nodes by source and target columns separately
27 views
Skip to first unread message

Purrsia Felidae
Nov 30, 2021, 6:41:06 PM11/30/21
to cytoscape...@googlegroups.com
Dear Cytoscape Team,
I am currently
in the process trying (and failing) to do a network analysis. I have a
.csv file that is the result of a Spearman correlation test, testing
individual amplicon sequence variants (ASVs) and my columns contain the
following information - I have included a screen shot of what it looks
like.
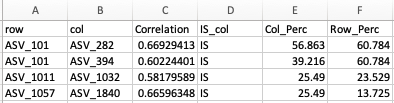
A brief description of the data I am inputting into Cytoscape:
-The row and columns refer the row and column names (in this case, ASVs) of the correlation matrix.
-The Correlation column is the Spearman's Correlation of that pair (row and col)
-The IS_Col is simply labeled IS bc this marks the ASV's (from the col column) I want to highlight (aka color).
-Col_Perc: Is the weight I want to use to size my nodes from the col column
-Row_Perc: Is the weight I want to use to size my nodes from the row column.
What I have done trying to size and color the network by source and target columns individually:
I ran across a similar issue in this post:
What he's asking is the same thing I want to do but I cannot seem to figure it out at all.
The solution, according to the post: "When you import them, you'll need to designate which Weight Column
(for my data my weights are the Row_Perc and Col_Perc) goes to the source nodes and which go to the target, and the same
with the Target column. Then they will get appropriately
assigned."
I went ahead and did this - here is my designations during import:
row = source node
col = target node
Correlation = edge attribute
IS_Col = target node attribute
Col_Perc = target node attribute
Row_Perc = source node attribute
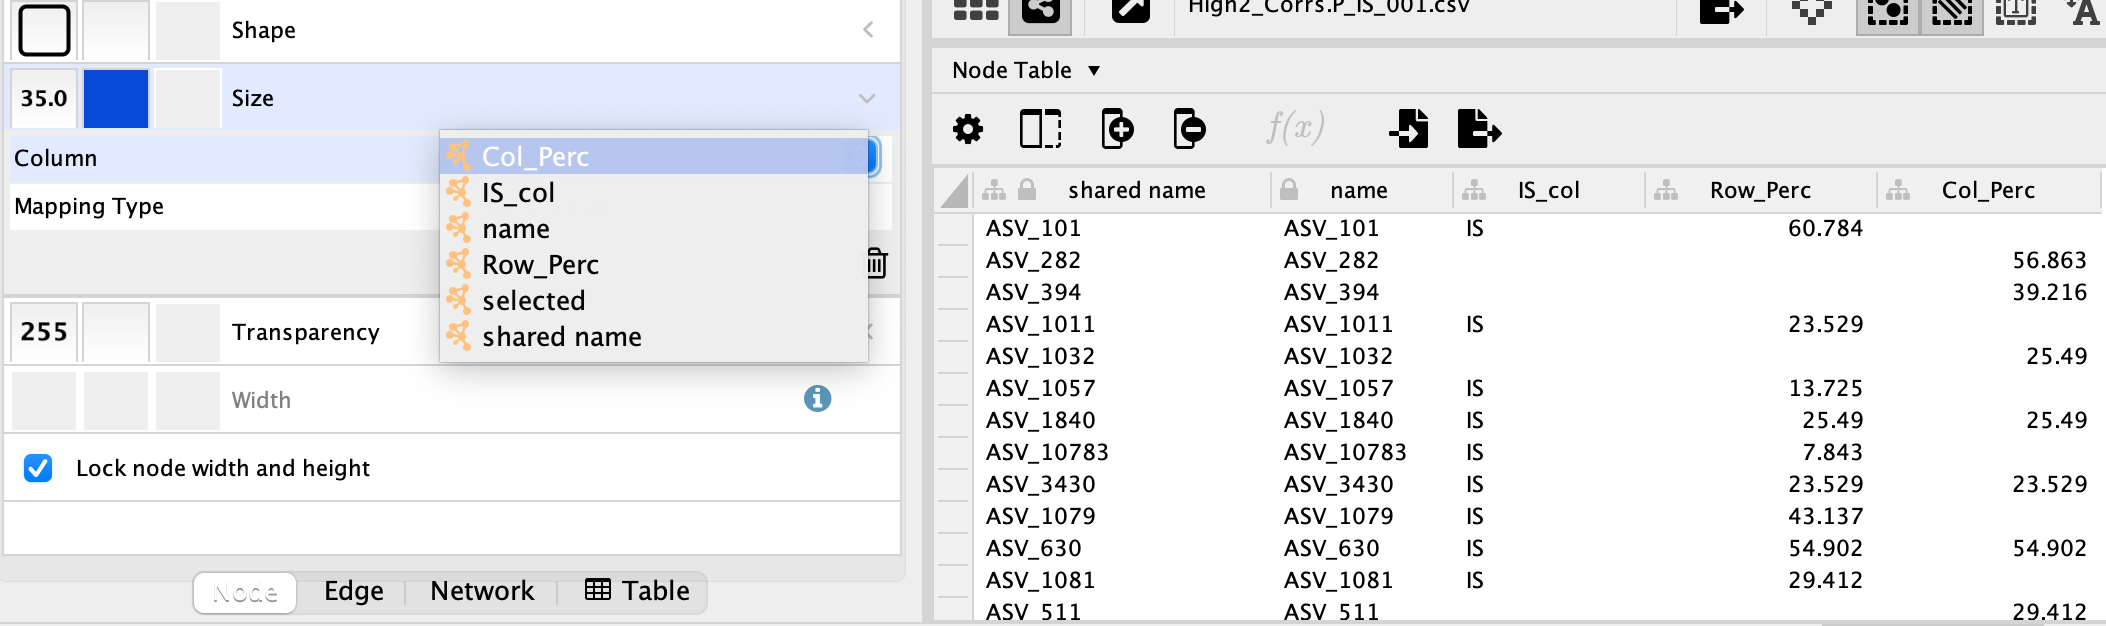
Next, I head on over to Styles --> Size.
Here is where I run into the issue. I can only choose one column for my size and adjust the rest of the node size based on a scalar! Here is a screenshot of my cytoscape session:
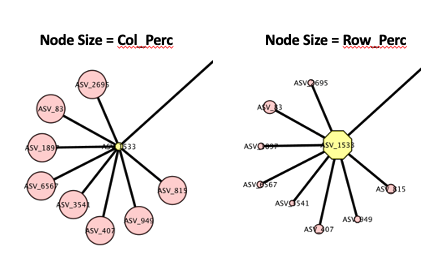
However,
this isn't what I need. I need to size both my source and target based
on their individual columns for weight - Row_Perc and Col_Perc,
respectively. Choosing either/or gives me 2 very separate looking
graphs!
This
is the same for the Style --> Fill Color - I can only choose ONE of
these columns to color the nodes - however, I need to color the source and target
nodes differently. If I choose my Fill Color as IS_col, it will ONLY
color my IS_Col and will not leave me another option to color the rest
of the nodes with a different color.
How can I go about sizing and coloring the nodes by source and target columns separately?
Any help would be greatly beneficial.

Scooter Morris
Dec 2, 2021, 11:48:14 AM12/2/21
to cytoscape-helpdesk
So, what you need to do is to import your data set twice. The first time, import it as a network with:
row = source node
col = target node
Correlation = edge attribute
IS_Col = target node attribute
Col_Perc = ignore
Row_Perc = source node attribute (but change the name of the imported column to Perc)
Now, import the same data set, but this time import it as a Table:
row = ignore
col = Key column -- map to name
Correlation = ignore
IS_Col = ignore
Col_Perc import, but change the name to Perc
Row_Perc = ignore
Now, your Perc column will contain the contents of Col_Perc for target nodes and Row_Perc for source nodes. Then you can use this for your mapping.
-- scooter
Purrsia Felidae
Dec 2, 2021, 10:59:47 PM12/2/21
to cytoscape...@googlegroups.com
Hi Scooter,
First, thank you so very
much for such a clear response on what to do . The import worked
absolutely beautifully, However, doing it this way I am quite astonished
to see how vastly different cytoscape handles the same data-set. I have
provided a screen shot after import the way you recommended and
choosing the same layouts as I did before your recommendation: Layout
--> yFiles circular layout and coloring and sizing them the exact
same.
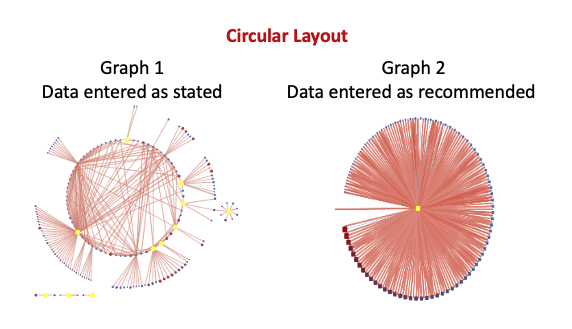
In graph 2 I have lost all of the outliers, different nodes
protruding out from the dots, the multiple cross-overs I see, etc. that
are visible in graph 1. Instead, what I get is a circle, with increasing
weights around the circle (clockwise). I would also like to add that,
yes, importing this way does allow me to size all nodes by the new
column Perc, but I cannot label which ASVs I have identified in my
column, IS_Col. For graph 2 It just puts a literal "IS" on certain
nodes, when I pass "IS_Col" under the Node --> Styles --> Label
--> Column. It does not label them with their respective ASVs, which
is what I need. My only option is an all or none approach - choose
'shared' in the Label column but I get all labels then. I will have to
manually add or remove each one in say, adobe illustrator, if I only
want the IS_Col ASV's identified or only the other ones identified. This
will be incredibly long and tedious. Its the same issue with Graph 1. I
cannot isolate, to label or color, size, etc. only certain groups
(e.g., IS_Col vs. Non IS_Col; source vs. target).
To note, for graph 1, it won't label at all when I choose: Nodes --> Styles --> Label --> Column, IS_Col.
So,
I'm back to my original inquiry: any way to be able to size, label,
color, etc. the source and target nodes separately from each other and
still keep the 'personality' of graph 1 in the process?
Thank you so very much for your time and help.
Cheers!
P.S.
the bue "Post message" radio button to click to actually post an inquiry or to reply directly via the google forum isn't working. I have had to go into my
actual gmail and send this directly to your email address each time. Just letting you know.
--
You received this message because you are subscribed to the Google Groups "cytoscape-helpdesk" group.
To unsubscribe from this group and stop receiving emails from it, send an email to cytoscape-helpd...@googlegroups.com.
To view this discussion on the web visit https://groups.google.com/d/msgid/cytoscape-helpdesk/488e7583-6617-4584-b800-9eddd9d05f07n%40googlegroups.com.
Scooter Morris
Dec 9, 2021, 11:16:33 AM12/9/21
to cytoscape-helpdesk
Hi,
I think that somehow things didn't get imported correctly the second time. The first time, when you import the data set as a network should give you Graph 1, just like before. The second time you do the import, you should be importing as a Node Table -- *not* a network, which should not change the graph in any way since you are not modifying the connectivity at all. As far as IS_Col -- I think I got things a bit messed up -- it should probably look like this:
So, what you need to do is to import your data set twice. The first time, import it as a network with:
row = source node
col = target node
Correlation = edge attribute
IS_Col = souce node attribute
Col_Perc = ignore
Row_Perc = source node attribute (but change the name of the imported column to Perc)
Now, import the same data set, but this time import it as a Table:
row = ignore
col = Key column -- map to name
Correlation = ignore
IS_Col = import
Col_Perc import, but change the name to Perc
Row_Perc = ignore
-- scooter
Reply all
Reply to author
Forward
0 new messages