stack plotting UDs
28 views
Skip to first unread message

MARTIN GOLOOBA
Apr 17, 2023, 10:50:03 PM4/17/23
to ctmm...@googlegroups.com
Hi Community,
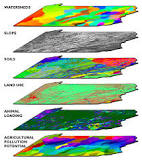
I have created home ranges for my animal for different years and I would like to overlay the layers together and have a stacked plot as my final output (see example attached rather than plotting them side-by-side.
If there is anyone familiar with the process, I would be grateful to acquire your assistance.
Here is the final code I used and I get one plot per year:
# Create Annual Plots
annual.plots <- prepare_plots_per_period(ud.tif.files = ud.annual.tif.files,
uds.gpgk.files = uds.annual.gpkg.files,
telemetry.files = telemetry.file.annual,
new.extent = extent.annual)
annual.plots[[1]]
annual.plots[[2]]uds.gpgk.files = uds.annual.gpkg.files,
telemetry.files = telemetry.file.annual,
new.extent = extent.annual)
annual.plots[[1]]
annual.plots[[3]]
Thank you,
Martin
Reply all
Reply to author
Forward
0 new messages