results explanation in comparing populations via meta function
100 views
Skip to first unread message

yu lei
Apr 16, 2022, 12:31:23 AM4/16/22
to ctmm R user group
Hi Chris,
Recently i analysed 16 crested ibis from hatch to 3 years old, then i wondering if the home range area and diffusion rate has difference among ages (1st-year, 2nd-year, 3rd-year). Your newly paper "Population-level inference for home-range areas" in MEE seems provide an appropriate way to realize my work.
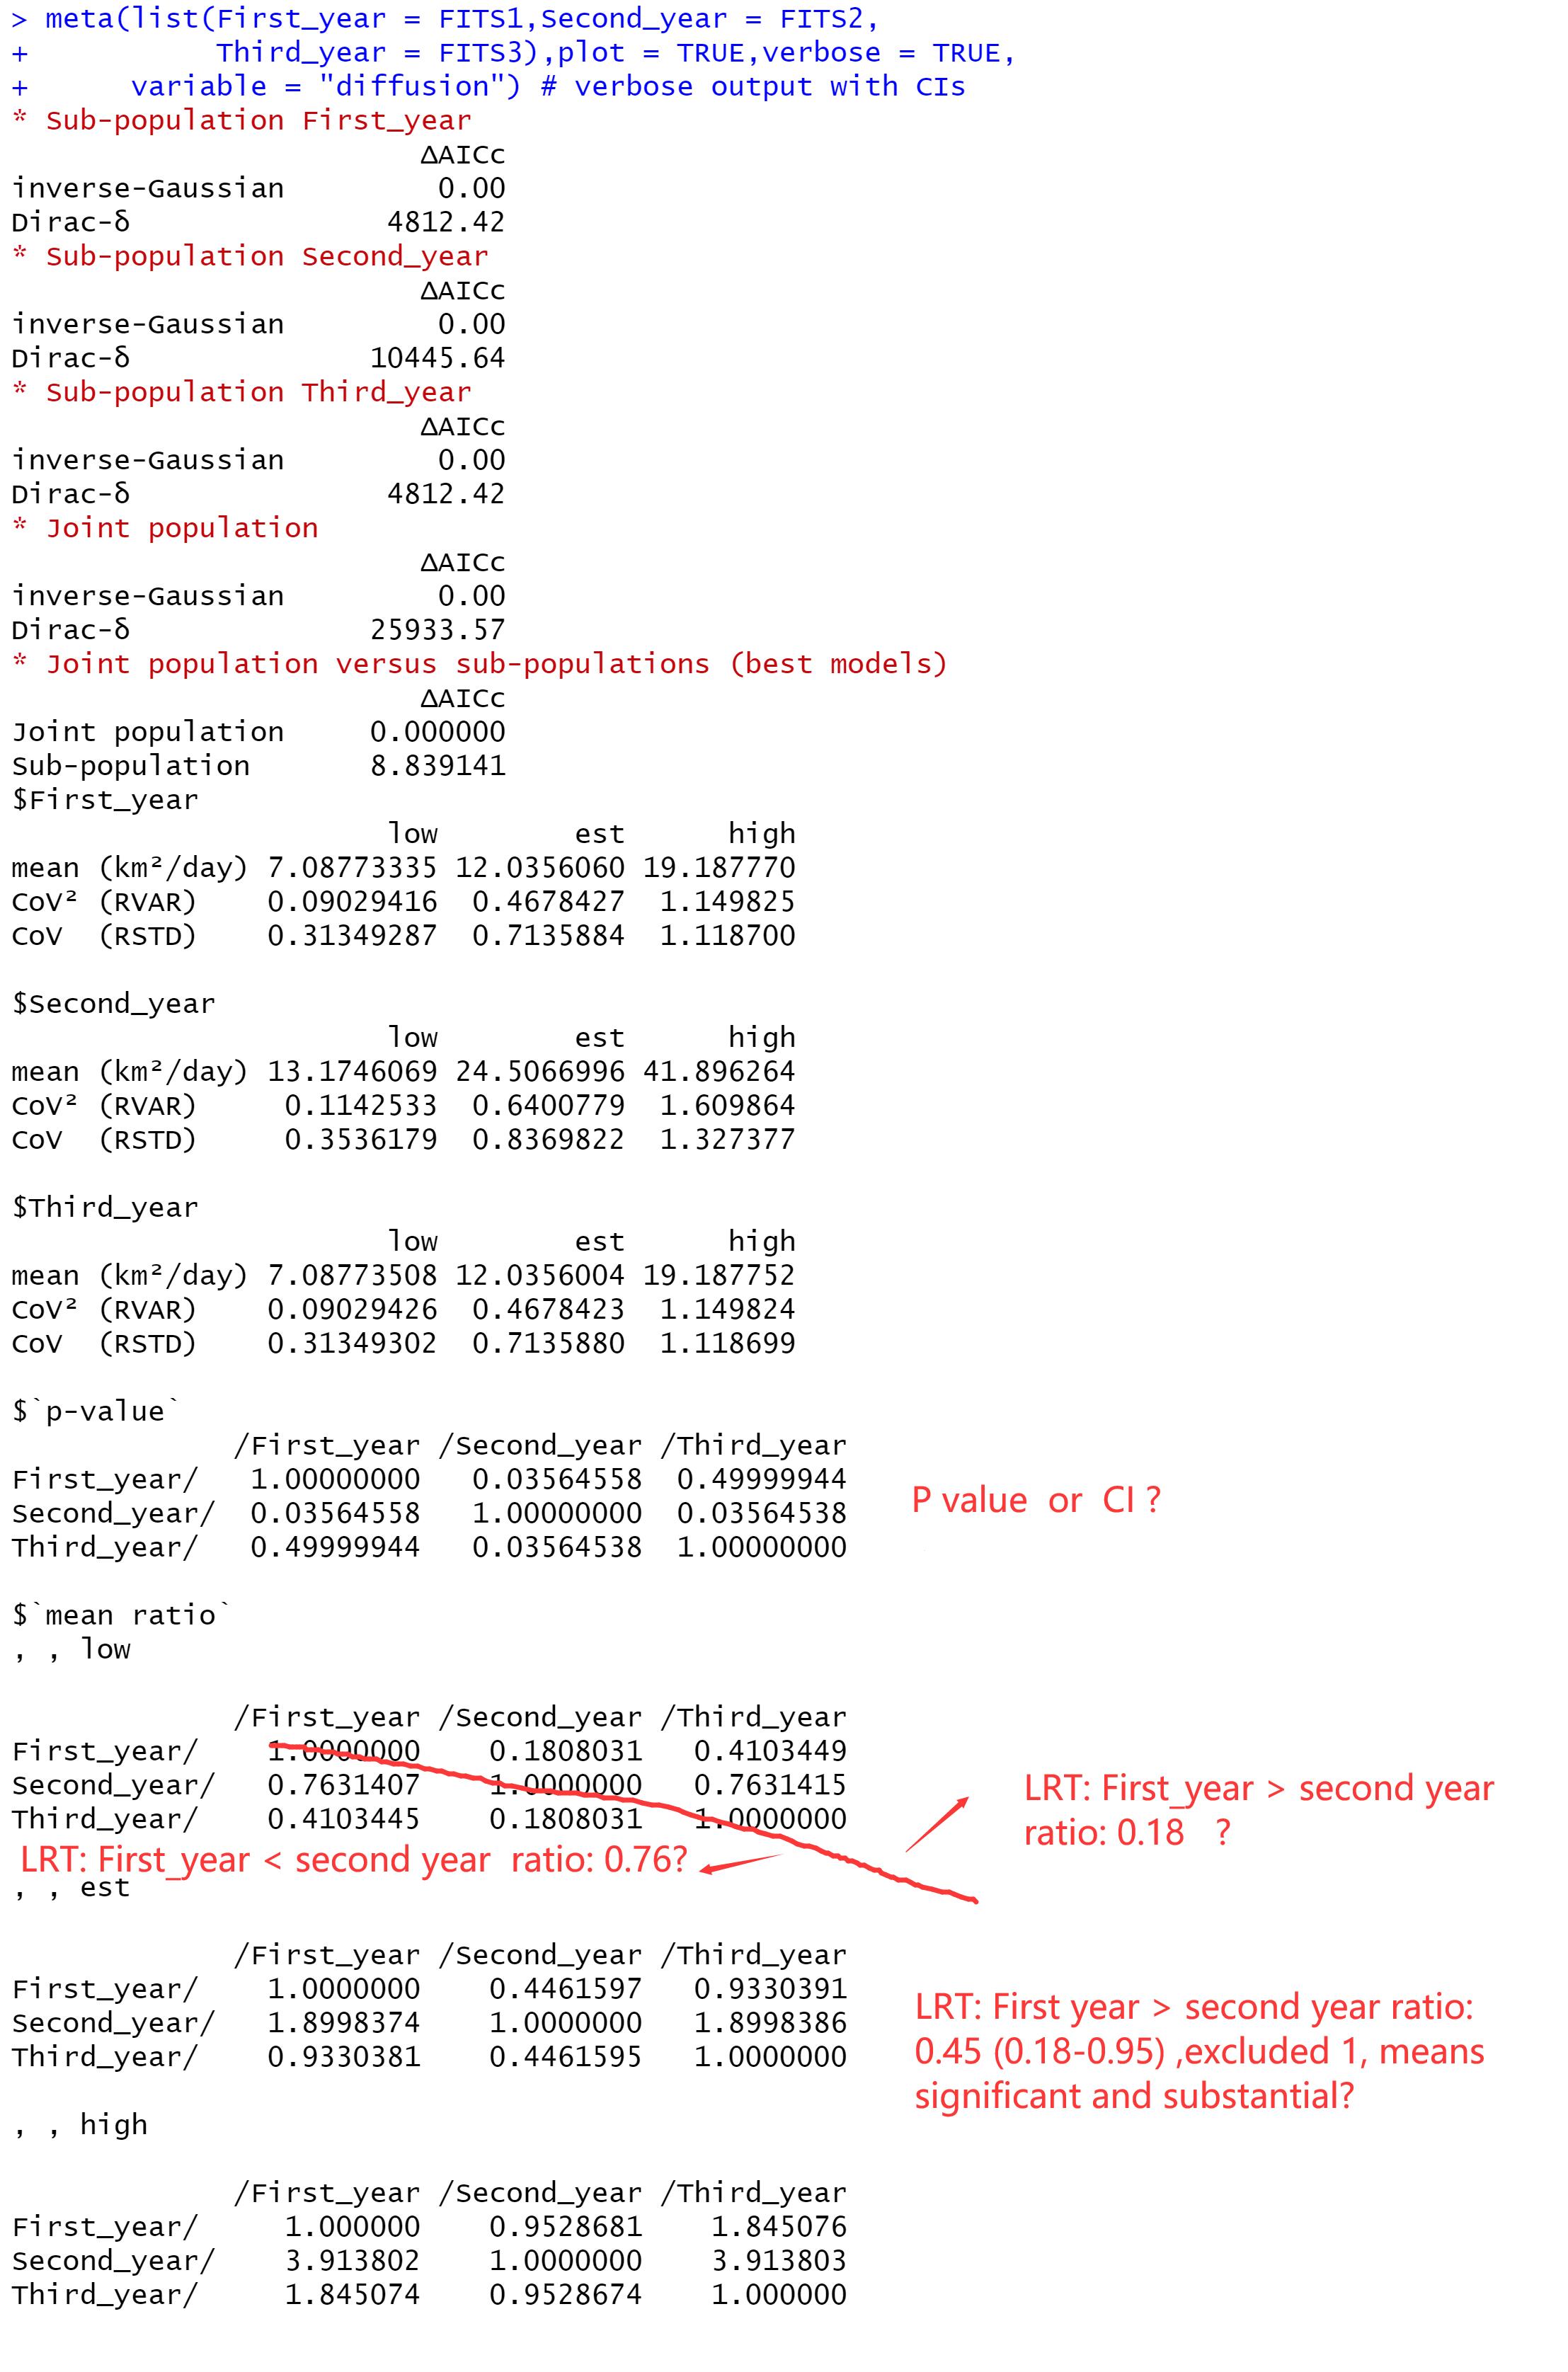
Now i have some problems about the output results (see below )from meta function.
1. You recommended estimation of effect sizes rather than significance tests when comparing populaitons, but i found the p value and CI in the results, which value should i choose, or considering them both to analyse? and P value < 0.05 means significant?
2. In the ratio CI part, the ratio means Likelyhood ratio test? I guess the right top in matrix of results means A > B ratio , and left bottom part means A < B ratio ? I can choose either of them.
3. Actually i'm unfamiliar with the effect size and CI estimation, in the mean (low - high) form, Can I understand that if there excluded 1 in low to high intervals, it means significant?
Thank you
Yu Lei

Christen Fleming
Apr 16, 2022, 9:35:17 AM4/16/22
to ctmm R user group
Hi
Yu Lei,
The CIs are more meaningful and contain more information. That's what I would report. The p-values are for whether or not the means are significantly different. 5% is a common threshold with limited data.
The ratio CIs are the estimated ratios of the mean variables. So, for instance, the first year mean diffusion rate / second year mean diffusion rate is estimated to be 0.45 (0.18-0.95). This difference is somewhat significant (p=0.036) but it may or may not be substantial, as ratio=0.18 is substantial, but ratio=0.95 is insubstantial.
The reciprocal ratio of the second year mean diffusion rate / first year mean diffusion rate is estimated to be 1.9 (0.76-3.9), which is not exactly the reciprocal of the previous estimate, because the bias corrections are not the same. In choosing which ratio to report, I find that large estimate / small estimate is easier to read, but the ratio with the larger sample size in the denominator has better statistical efficiency.
For ratios, if the CI excludes 1 then the difference is significant. But:
- The CIs are debiased, and the bias of a ratio and its reciprocal are different, so those p-values can be slightly different with small amounts of data, which is why the alternative (F-test based) p-value table is reported with verbose=TRUE. The symmetric F-test p-values have slightly better statistical efficiency for determining significance.
- The CIs have 1-level probability split between both sides, so a one-sided significance test at 5% would correspond to level=0.90 and not the default level=0.95, which corresponds to a one-sided test at 2.5%.
Best,
Chris
yu lei
Apr 16, 2022, 11:10:23 AM4/16/22
to ctmm R user group
Hi Chris,
Thank you for your prompt response. It help me a lot !!
Best,
Yu Lei
Reply all
Reply to author
Forward
0 new messages