GPS Unit calibration
227 views
Skip to first unread message

Maggie Creamer
Dec 31, 2020, 7:47:47 PM12/31/20
to ctmm R user group
Hello!
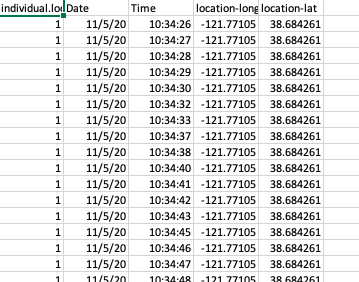
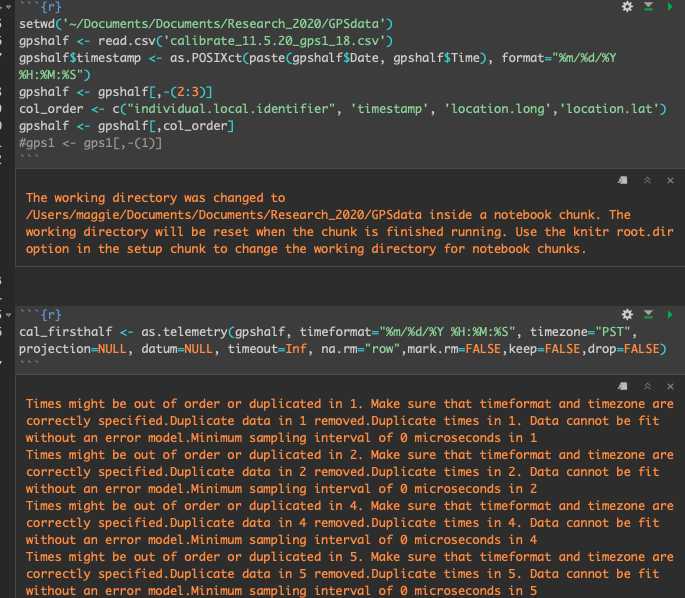
I have aggregated ~39 GPS unit calibrations into 2 separate CSV files (it was too much data for one CSV file, excel did not allow me to add more rows). I am trying to use the uere.fit function to look at the location error of the units to use for later calculations, but I cannot figure out how to see a list of location errors per unit. It appears I am getting an overall average error. I have attached a screenshot of the header of my data and two screenshots of the R code I am using (along with some error messages that I also do not understand)..
I am a fairly novice R user. Any advice would be greatly appreciated thank you!

Christen Fleming
Jan 1, 2021, 4:45:00 PM1/1/21
to ctmm R user group
Hi,
- You can run uere.fit() on individual deployments or on a list of multiple deployments (under the assumption of everything being equal) and compare. There is an example in vignette('error').
- I don't see that the file is exactly in Movebank format, as you don't have a timestamp column, but separate date and time columns... not that this would hurt the calibration step too much, but it would mess up tracking data analysis.
- I don't see any error information columns in your data. You don't have any DOP values or anything else? Is there some more complete dataset that these came from?
- I don't recommend editing your data in Excel, as it has a tendency to mangle timestamp formats.
Best,
Chris
Maggie Creamer
Jan 22, 2021, 5:43:13 PM1/22/21
to ctmm R user group
Hi Chris,
Sorry it took me so long to get back to you, this is an ongoing process and some other priorities got in the way.
1. So uere.fit only works on one gps unit? I thought you could aggregate a list of units to help with data processing and one of the uere functions would deliver a list of errors back that had different errors per unit. I can write a loop to read in one unit at a time, I just thought it could do the list.
2. In the R code I attached originally (I'll attach again to this email), you can see that I create a timestamp column using R that combines date and time. I found this easier than creating one in excel (have to manually account for time zone etc. when processing raw gps data).
3. Yes, there is a more complete data set that this came from (raw data attached). It has an EHPE column. Maybe I'm confused..I thought calibration with uere was supposed to calculate the error?
4. Ah yes, I have struggled with times in excel, but that's why I created the timestamp in R (again, code screenshot included)
Christen Fleming
Jan 22, 2021, 6:20:20 PM1/22/21
to ctmm R user group
Hi,
1. You can input calibration data from multiple GPS devices that are of the same type, in a list, to uere.fit().
The output model assumes they are all behaving similarly, which is usually but not always the case. You can then check the goodness of fit of the joint model versus the individualized models.
There is a simple example in vignette('error').
3. GPS errors tend to be heteroskedastic and while uere.fit() estimates some parameters, others (HDOP) must be supplied by the device as they vary by fix. I would try importing the EHPE column as an HDOP column if it is supposed to represent expected horizontal error. I looked at your attached calibration data and a homoskedastic error model slightly outperformed EHPE informed error, but the reception was generally very good and the results were very similar. EHPE might look better in other cases where the signal quality is poorer and the assumption of homoskedasticity is not as good. Also, the sampling here seems to be 1Hz (I assume this is one device?) whereas GPS location estimates tend to be autocorrelated over a 1-2 minute timescale, so as a warning this will overestimate AIC differences and underestimate CI widths.
Best,
Chris
Maggie Creamer
Jan 22, 2021, 7:31:46 PM1/22/21
to ctmm R user group
Hi Chris,
Thank you so much for your swift and thoughtful reply! This is so helpful!!
I see! That makes sense!
Yes, I just did one second intervals for calibration (I wasn't sure which is the best interval to use for calibration - is 2 minutes best? My sampling will be at 10min intervals when I track animals, should I calibrate at the same interval?)
Best,
Maggie
Christen Fleming
Jan 23, 2021, 1:48:54 AM1/23/21
to ctmm R user group
Hi Maggie,
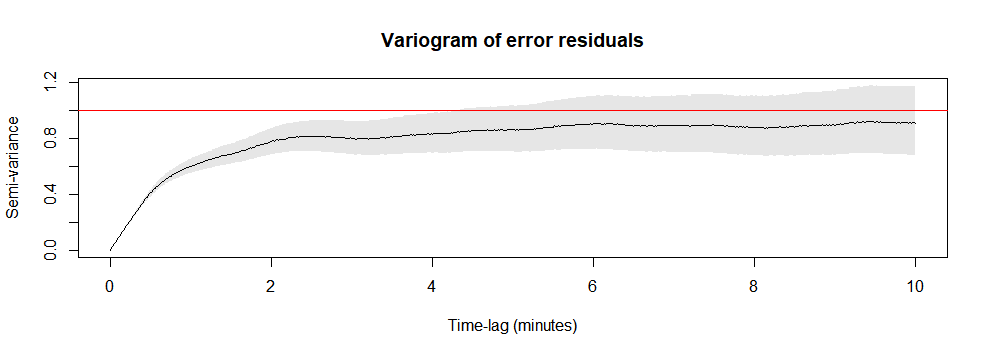
I would collect calibration data at or above ~1-2 minutes in that case. You aren't really getting any additional information by going to 1Hz. I've attached a plot of the variogram of the residuals up to 10 minutes and you can see how autocorrelated the location errors become as you approach 1Hz. At 1 minute sampling, you have around 50% autocorrelation in location error. At 1Hz sampling, you have 99% autocorrelation.
Best,
Chris
Maggie Creamer
Jan 23, 2021, 3:39:00 PM1/23/21
to ctmm R user group
Thank you so much for all your help!!
Maggie Creamer
Mar 3, 2021, 12:47:58 PM3/3/21
to ctmm R user group
Hi again Chris,
I put this under the same header because I am still having trouble with getting the full error vignette to run. I have calibration data for one gps unit (2 min fix according to our previous conversation) and pilot data from the same unit that I am trying to calibrate from one pasture (you will see the pastures subsetted by timestamp). The summary(UERE) output does not quite look correct to me and the plots are not really working. Do you mind looking at my code (attached)? Sending along the data sheets used in the code as well.
Best,
Maggie
Christen Fleming
Mar 3, 2021, 12:57:47 PM3/3/21
to ctmm R user group
Hi
Maggie,
I just need a couple of days and I can get to it. I'm right in the middle of adding features to the error models.
Best,
Chris
Maggie Creamer
Mar 3, 2021, 1:10:12 PM3/3/21
to ctmm R user group
Hi Chris,
No worries at all! Thank you@@
Best,
Maggie
Christen Fleming
Mar 9, 2021, 2:20:42 PM3/9/21
to ctmm R user group
Hi
Maggie,
You have multiple "outliers" in the data where long-lat is (0,0), but it's really empty data rows. You just need to add a line to remove those from the data and it looks fine to me, with EHPE looking something like the standard deviation of the error in centimeters.
Best,
Chris
Reply all
Reply to author
Forward
0 new messages