Range Shifts and Boundaries
379 views
Skip to first unread message

Michael Taylor
Aug 4, 2021, 3:33:40 AM8/4/21
to ctmm R user group
Hi Chris,
I am working on an analysis for a group of sea turtles using ctmm, but have a couple of queries I hope you could help with.
- At least one of my turtles undergoes a number of range shifts during the tracking period. Am I correct in thinking that when sallies or range shifts
occur the "travelling" sections should be removed and ctmm run
separately on each identified period of range residency? (i.e. if a track
shows range residency in area A, then moves to area B, and finally returns
to be resident in area A again that should result in 3 unique ctmm and
akde calculations for that individual)
- I have seen you mention segclust2D as a method to separate tracks. To add another method to the list I have tried to use a BCPA to identify different blocks of similar behaviour and so far it seems to be working nicely.
- I
am also trying to incorporate land barriers. I have seen that this is planned for the future, and a few alternate methods have been suggested (here, here,
and here). As
far as I can tell the current best advice for barriers in ctmm is to mask
CDF in the AKDE, is this still correct?
- The method you and Tom discuss (here) seems the most applicable, but I am struggling with the computing time and I have not even started to run this for multiple UDs.
- Using Tom's example it took 4 hours 19 minutes to mask a single UD. sp::over was slightly faster at 3 hours 39. So far I have not got sp::pointsinpolygon to work properly (probably user error). Do you have any other advice for speeding up this approach, as I may need to do this for ~50 KUDs eventually?
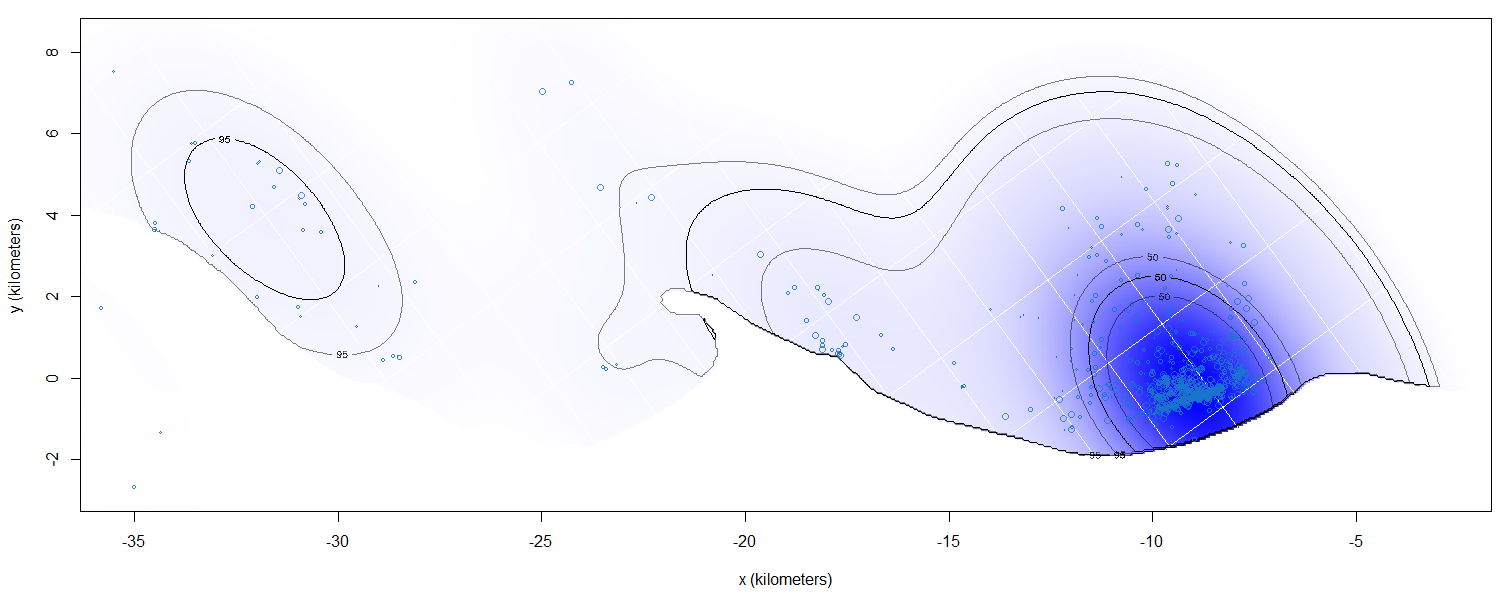
- I also have animals where the barrier is a narrow peninsula. Masking the land can leave part of the UD orphaned on the other side of the peninsula (see attached). Other than creating custom masks for each individual I am coming up blank on any other methods to avoid this issue. Any pointers would be greatly appreciated!
Thanks for all the resources you have provided here, and the vignettes, they have been a great help to get started on ctmm!
Cheers,
Mike

Christen Fleming
Aug 5, 2021, 4:20:33 AM8/5/21
to ctmm R user group
Hi Mike,
You are correct with respect to the ranging behavior.
Yes, masking the CDF is an easy, local correction that works fairly well, considering the existing alternatives.
Yup, simple masking will not accurately describe motion around boundaries. The boundary effect has to be applied at the level of the diffusion model to fully correct for that. A more appropriate model would have the probability density diffuse only partially around the boundary, as time & motion permits. I will not have this kind of model in ctmm for some time.
Best,
Chris
Michael Taylor
Aug 9, 2021, 9:50:40 PM8/9/21
to ctmm R user group
Thanks Chris,
Masking seems to be the best approach at this stage. I know adehabitatHR has a method for including simple boundaries, but this is limited when dealing with complex coastlines and I would prefer to use ctmm unless there were a definitive need to use an alternative.
As for the masking method, I was using the rgeos::gContains method that Tom posted, but I found that adapting it to use sp::over was slightly faster (3.5 hrs vs 4.35 hrs)
UDS <- AKDE[[1]]
for(i in 1:nrow(UDS$CDF)) {
for(j in 1:ncol(UDS$CDF)) {
point <- data.frame(x = UDS$r$x[i], y = UDS$r$y[j])
coordinates(point) <- c("x", "y")
proj4string(point) <- proj4string(SB_water_sp)
T_F <- sp::over(point,SB_water_sp)
T_F <- as.logical(ifelse(is.na(T_F),FALSE,TRUE))
if((T_F) == F) {
UDS$CDF[i, j] <- 1
}
}
}
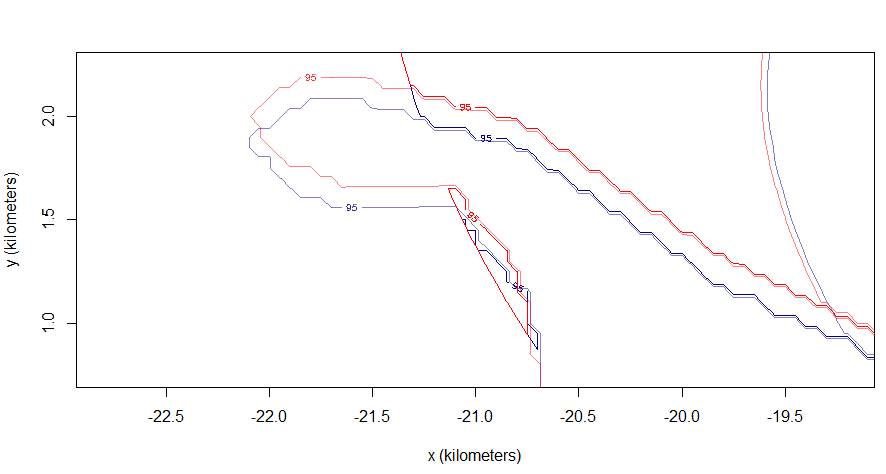
I then adapted (below) the raster method that Tom first posted and it is a lot faster (30 minutes rather than 3.5 hrs), but I ran into the same issue as Tom where it did not line up correctly (in the attached example blue is from raster and red from sp::over, when I plot the shapefiles in ArcMap the red shapefile lines up with the mask perfectly and the raster method is ~100 m off). I think this was an issue with getting the extent of UDs. This was originally:
# get extent of ‘UD’
xmin = raster::extent(UD)[1,1]
xmax = raster::extent(UD)[2,1]
ymin = raster::extent(UD)[1,2]
ymax = raster::extent(UD)[2,2]
This bit of script also caused the 95% CIs to be cut. below I have detailed the new version I am using where I extract the extent values from UDS$r$x and UDS$r$y respectively. This appears to work, but I have not had the chance to double-check this against multiple UDs. This still takes ~30 minutes, but it should be possible to get it working faster.
UD <- AKDE[[1]] # extract first UD for testing
#Load in shapefile
SB_water_sp <- raster::shapefile("SB_Outline_SimpleR_Water.shp")
# Set to same projection as UD
SB_water_sp <- sp::spTransform(SB_water_sp, CRSobj = projection) #ctmm::projection(UD))
# make new raster same col/row as UD:
ra <- raster::raster(ncol = ncol(UD[[8]]), nrow = nrow(UD[[8]]))
# get extent of ‘UD’
xmin = min(UD2[[11]][[1]])
xmax = max(UD2[[11]][[1]])
ymin = min(UD2[[11]][[2]])
ymax = max(UD2[[11]][[2]])
# change extent of ‘ra’ to extent of ‘UD’:
raster::extent(ra) <- c(xmin, xmax, ymin, ymax)
# rasterize ‘SB_water_sp’ to ‘ra’ :
ra <- raster::rasterize(SB_water_sp, ra, field = 1)
# flip the raster
ra <- raster::flip(ra, direction = 'y')
# resample to ‘UD’ to align to ‘UD’:
rr_ra <- raster::resample(ra, ctmm::raster(UD))
# Change values so that we have ‘1’ for ‘shape’ and ‘NA’ for ‘not-shape’:
rr_ra[rr_ra][rr_ra[rr_ra] > 0] <- 1
# for loop to mask to ‘shape’:
for(i in 1:ncol(UD$CDF)) {
for(j in 1:nrow(UD$CDF)) {
if(is.na(raster::as.matrix(rr_ra)[i,j])) {
UD$CDF[j, i] <- 1 # i and j are reversed here
}
}
}
I was also wondering if there was a simple way to plot shapefiles over ctmm.plot and if it is easy to change the axis so that x and y are at 0 for publication purposes?
Thanks for your help,
Mike
Christen Fleming
Aug 10, 2021, 4:15:31 PM8/10/21
to ctmm R user group
Hi Mike,
Calculating raster::as.matrix(rr_ra)[i,j] for each i,j is going to cause some slowdown. I would calculate is.na(raster::as.matrix(rr_ra)[i,j]) once outside the loop and access its [i,j] element inside the loop.
I just added shapefile support to plot.telemetry() in the GitHub development branch.
If you want the axes to be centered on (0,0) then you can try setting the projection for that individual before analysis, like
projection(DATA) <- median(DATA)
Best,
Chris
Michael Taylor
Aug 13, 2021, 2:19:39 AM8/13/21
to ctmm R user group
Hi Chris,
The pointer on moving
raster::as.matrix(rr_ra)[i,j] out of the loop was a great one. Masking now takes seconds rather than minutes/hours, and i am able to loop the code and mask multiple KDEs in a matter of seconds.
Thanks also for adding shapefile support to plot telemetry, this will be really useful for sharing results with colleagues quickly. Unfortunately, I am getting a warning when plotting and the shapefile does not plot
plot(AKDE[[1]], level.UD=c(0.5, 0.95), SP = SP, units=TRUE)
WARNINGS:
1: In plot.window(...) : "SP" is not a graphical parameter
2: In plot.xy(xy, type, ...) : "SP" is not a graphical parameter
3: In axis(side = side, at = at, labels = labels, ...) :
"SP" is not a graphical parameter
4: In axis(side = side, at = at, labels = labels, ...) :
"SP" is not a graphical parameter
5: In box(...) : "SP" is not a graphical parameter
6: In title(...) : "SP" is not a graphical parameter
7: In graphics::segments(x0 = X[j, 1], y0 = Y[j, 1], x1 = last(X[j, ... :
"SP" is not a graphical parameter
There are over fifty warnings. However, by reconstructing the script from the code in the plot.telemetry() function (below) I can get the maps that I am looking for. Do you think the issues that are ocurring above is an issue on my end?
SP <- SB_land
PROJ <- "+proj=tpeqd +lat_1=-25.7199142494061 +lon_1=113.634047157365 +lat_2=-25.8607177794747 +lon_2=113.748002084076 +x_0=0 +y_0=0 +datum=WGS84 +units=km +no_defs" # changethe projection to units = km (this is automatically done in plot.telemetry)
SP <- sp::spTransform(SP,CRSobj=PROJ)
sp::plot(SP,col="grey25",border = "black", add=TRUE)
Finally I have been using the compass() function, but have found that when printing a pdf the function has a number of warnings related to the arrow graphic (1: In text.default(x, y, labels = "<U+27A2>", adj = c(0.5, ... :
conversion failure on '➢' in 'mbcsToSbcs': dot substituted for <e2>) and the output pdf has a dotted line instead of the arrow.
Cheers,
Mike
Christen Fleming
Aug 13, 2021, 12:50:18 PM8/13/21
to ctmm R user group
Hi Mike,
Did you get the package updated from GitHub via: devtools::install_github("ctmm-initiative/ctmm") ? Because that error sounds like the old function without an SP argument is still there? Maybe try uninstalling the package and installing again in a fresh session. Sometimes devtools fails to overwrite files silently. If that still gives an error, then please send me a minimal working example (data & script) and I will fix it.
For the encoding issue, plotting PDFs in R with UTF-8 characters requires fiddling, like this:
data(buffalo)
cairo_pdf(file="test.pdf",family="DejaVu Sans")
plot(buffalo[[1]])
compass()
dev.off()
cairo_pdf(file="test.pdf",family="DejaVu Sans")
plot(buffalo[[1]])
compass()
dev.off()
where the font family needs to be able to convert whatever characters you have in your plot. I will put this in the help file.
Best,
Chris
Michael Taylor
Aug 17, 2021, 10:15:22 PM8/17/21
to ctmm R user group
Hi Chris,
Thanks for fixing up the plotting for shapefiles. You were right in the boundary not looking correct. I thought I was being smart in sending through some simulated data, but I did something wrong and it was actually away from the boundary. That said it all seems to work now.
Thanks for all of your help!
Cheers,
Mike
Reply all
Reply to author
Forward
0 new messages