Unexpected behaviour of ctmm.select (range=false)
56 views
Skip to first unread message

abern...@gmail.com
Apr 27, 2023, 1:13:42 PM4/27/23
to ctmm R user group
Hi Chris,
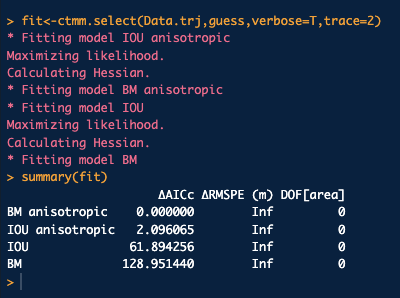
I have an example here where ctmm.select is selecting BM as the best model when it's clearly (I think) IOU motion. What do you think is happening here? Thanks so much in advance!! Robin
library(sf)
library(ctmm)
load("huh.sf.rda")
load("huh.rda")
###########################
#define projection
TPEQD<-"+proj=tpeqd +lat_1=64.2 +lon_1=-112.5 +lat_2=65.8 +lon_2=-111.04 +x_0=0 +y_0=0 +datum=WGS84 +units=m +no_defs"
###########################
#function to coerce data into ctmm trajectory
prepare_ctmm_data<-function(x){
#convert to movestack
DATA<-move(x=x$longitude,y=x$latitude,
time=as.POSIXct(x$observationDate, format="%Y-%m-%d %H:%M:%OS", tz="UTC"),
proj=CRS("+proj=longlat"))
#convert to ctmm telemetry object
DATA.trj<-as.telemetry(DATA,timeformat = "auto",timezone="UTC", projection=TPEQD)
return(DATA.trj)
}
###########################
#Plot huh.sf
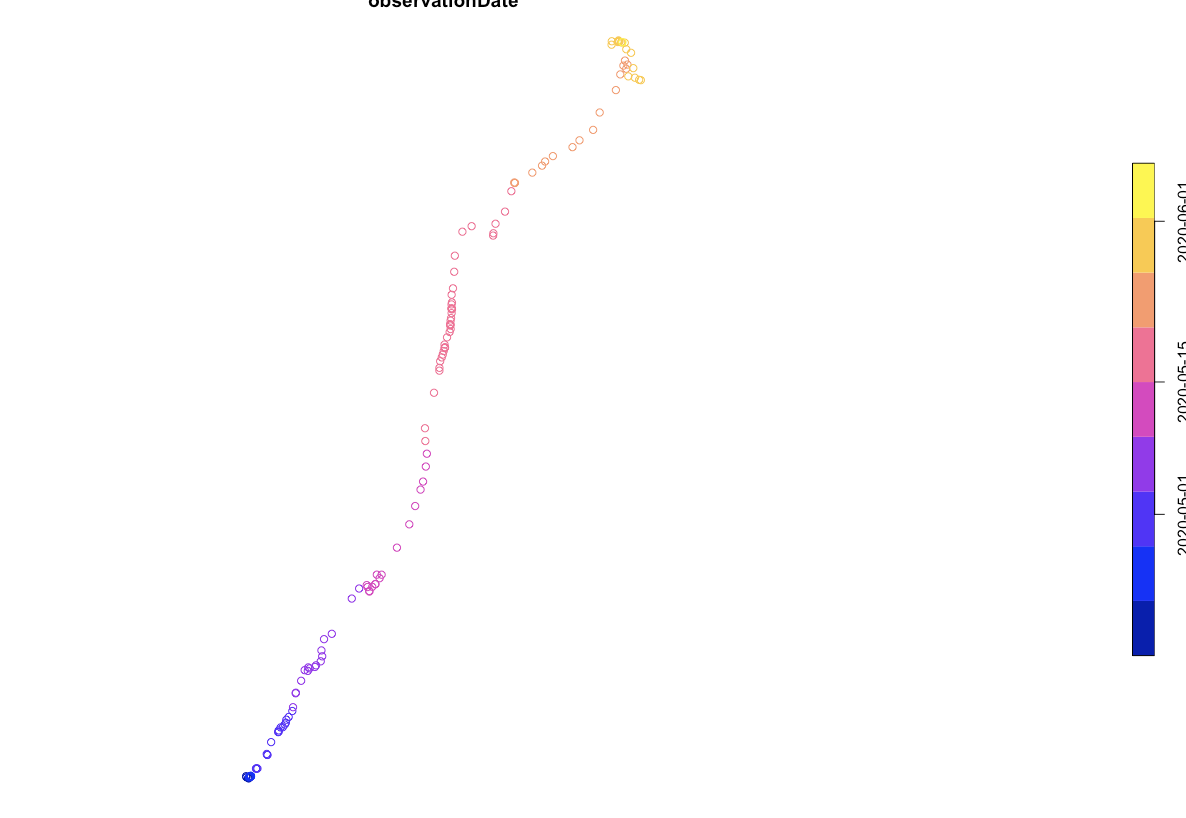
#I think obviously not BM, definitely IOU
plot(huh.sf)
#Run ctmm fit
Data.trj<-prepare_ctmm_data(huh)
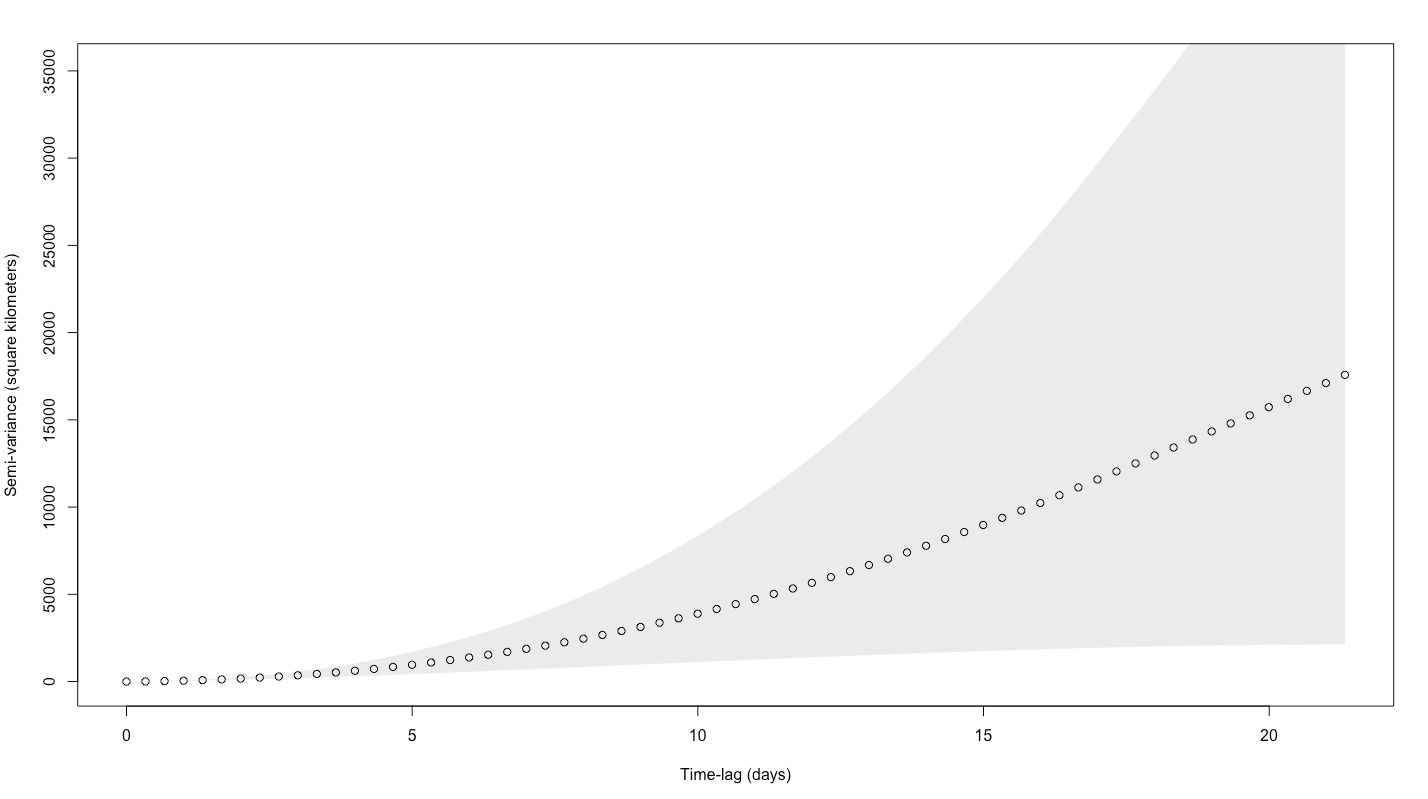
variogram<-variogram(Data.trj)
plot(variogram)
guess<-ctmm.guess(Data.trj,CTMM=ctmm(error=FALSE,range = FALSE),interactive=FALSE)
summary(guess)
fit<-ctmm.select(Data.trj,guess,verbose=T,trace=2)
summary(fit)
library(ctmm)
load("huh.sf.rda")
load("huh.rda")
###########################
#define projection
TPEQD<-"+proj=tpeqd +lat_1=64.2 +lon_1=-112.5 +lat_2=65.8 +lon_2=-111.04 +x_0=0 +y_0=0 +datum=WGS84 +units=m +no_defs"
###########################
#function to coerce data into ctmm trajectory
prepare_ctmm_data<-function(x){
#convert to movestack
DATA<-move(x=x$longitude,y=x$latitude,
time=as.POSIXct(x$observationDate, format="%Y-%m-%d %H:%M:%OS", tz="UTC"),
proj=CRS("+proj=longlat"))
#convert to ctmm telemetry object
DATA.trj<-as.telemetry(DATA,timeformat = "auto",timezone="UTC", projection=TPEQD)
return(DATA.trj)
}
###########################
#Plot huh.sf
#I think obviously not BM, definitely IOU
plot(huh.sf)
#Run ctmm fit
Data.trj<-prepare_ctmm_data(huh)
variogram<-variogram(Data.trj)
plot(variogram)
guess<-ctmm.guess(Data.trj,CTMM=ctmm(error=FALSE,range = FALSE),interactive=FALSE)
summary(guess)
fit<-ctmm.select(Data.trj,guess,verbose=T,trace=2)
summary(fit)

Christen Fleming
Apr 27, 2023, 3:47:51 PM4/27/23
to ctmm R user group
Hi Robin,
If these are Argos data, then they might need a location error model.
There could also be an issue with the segments of the data that correspond to stop-over points having a very different autocorrelation structure. You might need to segment the data for that.
Best,
Chris
abern...@gmail.com
Apr 27, 2023, 4:13:07 PM4/27/23
to ctmm R user group
Thanks Chris! Ok, no these are GPS Irridum datasets, not using "error" model because these are big movers (Migratory caribou). This data was already stratified to the migration time period (by date, not by inspecting the paths). Here is a screenshot of the path for the migration period, and it does abruptly change at the end. So you think that would be enough to sway the model choice to BM? This is about a 6 week period of time
R

Christen Fleming
Apr 27, 2023, 9:18:28 PM4/27/23
to ctmm R user group
Hi Robin,
Yeah, I think there is too much difference in the autocorrelation structure within the track. If you consider an IOU process with 5-day velocity autocorrelation, then it is extremely improbably for it to kink like that on an hourly timescale, wherein velocities should be 99% autocorrelated. I checked the profile of the log-likelihood and there is a peak at 1.43 hours that you can fit if the guess isn't extremely far from that, but the visual fit of ~5 days does not show up in the likelihood function, even though it's clear in the (default) 8-hour variogram.
Your data has 8-hour and 1-hour (not shown by default) fixes and if you look at the autocorrelation structure of the 1-hour data, then it does look more like the 1.4-hour timescale, so it does look like there are a mix of behaviors in the dataset.
Best,
Chris
Reply all
Reply to author
Forward
0 new messages