trouble interpreting model fit with different error models
257 views
Skip to first unread message

aie...@oregonstate.edu
May 26, 2021, 5:04:06 PM5/26/21
to ctmm R user group
Hi Chris,
I'm continuing my quest to deal with my extreme, multi-path errors in data from bighorn sheep collars. It's beyond my capabilities to use something like template model builder to implement a heavy-tailed error distribution, so I tried a different approach. Using stationary data, I built an external error model that predicts the position error in meters because it allowed for a little more flexibility/complexity in the model structure. I've tried to use these predictions in two ways ...
1) I assigned the predicted error to the HDOP column in the stationary data and use uere.fit to estimate how this relates to error - expecting the result to be near 1. The UERE estimate was 1.29 and when compared to any error model I've tried to fit with ctmm in the past, it is far superior, with a Z^2 of 1.9. Anything else I've tried with the same data would only get down to a Z^sq of about 5-6, unless I removed a lot of outlier data. I then assigned this UERE to my bighorn collar data and ran ctmm.fit. This resulted in much larger VAR.xy values than approach #2...
2) I also assigned the predicted error directly to the VAR.xy column of bighorn data, and ran ctmm.fit using this as the error model.
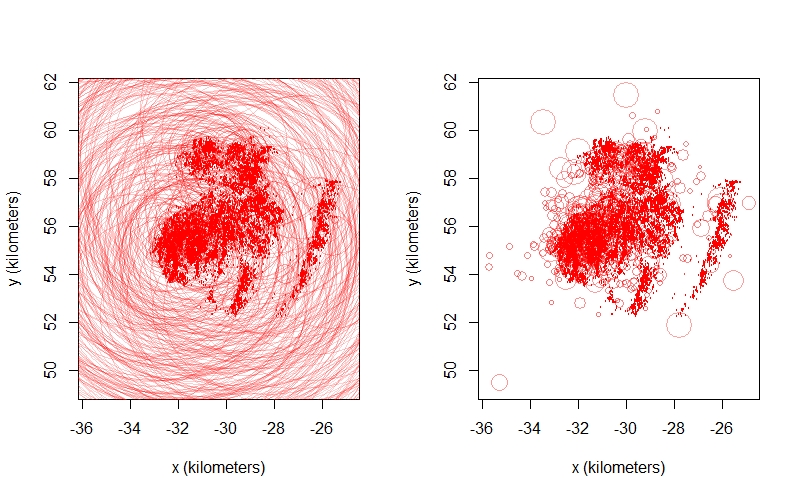
Points with error from approach 1 on the left, approach 2 on the right for one bighorn
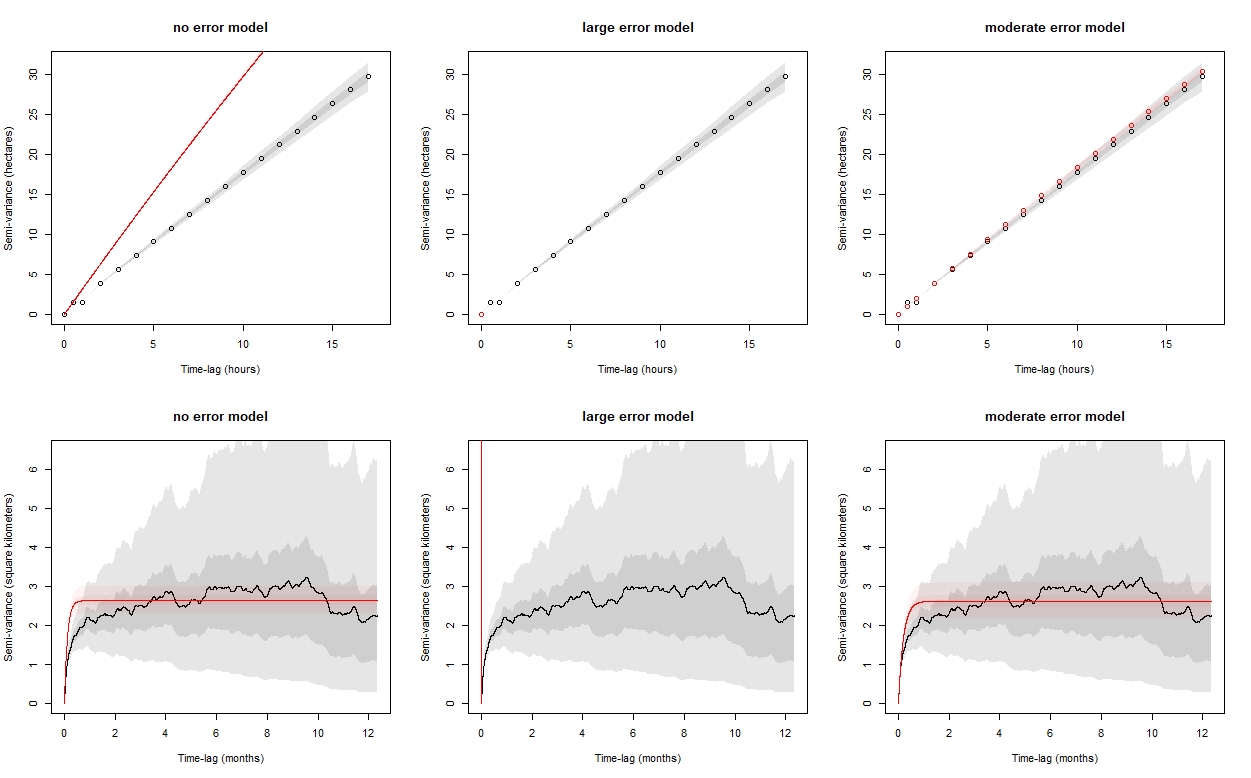
I took one of the collars with the worst error in the data, and compared a no error model to models created from the above approaches. I looked at the semivariograms, the AIC values, and the predicted paths conditioned on the data. The AIC values suggest that the first approach, using the UERE with the predicted errors as the HDOP was a better fit, and the predicted locations are doing what I hoped - pulling in irregular "spikes" and predicting locations that are more reasonable given how I expect bighorn to move through these areas. This model also suggests that there is more autocorrelation in velocity than the other two models, which is what I would expect from bighorn movement. The semivariogram though, looks crazy and I'm not sure what's going on there or what this indicates. I wonder what you make of this...I can send you the data and code that I used to get to this point if you'd be willing to take a closer look.
Many thanks,
Christina

Christen Fleming
May 27, 2021, 4:20:46 PM5/27/21
to ctmm R user group
Hi Christina,
What are you assigning to the columns, exactly? The HDOP column should be sqrt(2) * standard_deviation of the errors in in each dimension to get an RMS UERE of 1. Without the sqrt(2), you should get an RMS UERE of
1.41.
Is this with a recent version of the package, and can you provide me with a minimal working example (data + script) to look at? I'm not really sure what's going on from looking at things.
Best,
Chris
aie...@oregonstate.edu
May 27, 2021, 4:59:57 PM5/27/21
to ctmm R user group
I did not multiply by sqrt(2) for the HDOP column, so I guess that explains why the estimated UERE was ~1.3 - assuming that only a perfect prediction would produce 1.41 exactly. I'll email you a zip file that contains the UERE that resulted from that HDOP assignment without the sqrt(2), the bighorn data I used in this example with that UERE already assigned, and the code I used to try both approaches and compare model fits. If you need the stationary data too, let me know and I can send that along as well. As always, extremely thankful for you to take a look at this and let me know if I screwed anything up here or if this odd variogram suggests something flawed with the model.
Christina
aie...@oregonstate.edu
May 27, 2021, 5:16:15 PM5/27/21
to ctmm R user group
Sorry I forgot to mention the ctmm version I used was 0.6.0
Christen Fleming
May 28, 2021, 3:09:14 AM5/28/21
to ctmm R user group
Hi Christina,
I first need to know what your "predicted error" (pred.error) is supposed to correspond to. Is pred.error=VAR[x]=VAR[y] or is pred.error=SD[x]=SD[y] or something proportional to one of those? From the range of values, I'm guessing that it's supposed to be a variance in square meters?
Assuming that its supposed to be VAR[x] & VAR[y], then you would want to do something like
data$HDOP <- sqrt(2 * data$pred.error)
uere(data) <- 1 # you can possibly improve this with uere.fit() but I don't really know where these values come from to say
uere(data) <- 1 # you can possibly improve this with uere.fit() but I don't really know where these values come from to say
You should then have a VAR.xy column that is equal to your pred.error column (and with other variables set correctly in the latest versions of the package).
I checked and this has a reasonable looking plot and reasonable looking fit. There was no velocity autocorrelation selected for me with the RMS UERE set to 1, but I also didn't see any hint of that in the variogram even with error=TRUE.
I would try to stick to doing any error model selection on the calibration data, before working with the tracking data. There are known identifiability issues with the simultaneous estimation of error & movement parameters and I have also seen similar weirdness with simultaneous model selection on the error & movement models.
Best,
Chris
aie...@oregonstate.edu
Jun 2, 2021, 12:54:00 PM6/2/21
to ctmm R user group
Hi Chris,
Sorry I missed this message, it was kicked to my junk mail for some reason. The field pred.error was the Euclidean distance of the point to the median location of the collar so sqrt( [x1-x2]^2 + [y1-y2]^2)
And for the example trajectory, I didn't think I was simultaneously fitting the the error and movement model - I had assigned a uere to this track and then fit the model with error = TRUE, which I assumed was taking into account the already assigned error model, not trying to estimate it along with the ctmm. Am I wrong in that?
Christina
aie...@oregonstate.edu
Jun 2, 2021, 1:30:33 PM6/2/21
to ctmm R user group
I'm also not clear as to how you would compare error model fits in the situation where you assign the uere value directly.
So say I took my stationary data and did the following...
data$HDOP <- sqrt(2 * data$pred.error)
uere(data) <- 1
uere(data) <- 1
How would I compare this model to one where I ran uere.fit(data) using that HDOP column? Directly assigning the uere to 1 doesn't produce a Z^2 or AIC estimate so I'm not sure how to make a comparison of this error model to another.
Normally I make these model comparisons on the stationary data first but ran into that hiccup.
Christen Fleming
Jun 2, 2021, 4:02:27 PM6/2/21
to ctmm R user group
Hi Christina,
I'm not exactly clear on
what you are doing. You fed some stationary data into a habitat-informed
model and made habitat predictions of the error in meters? The numbers
in that column are sometimes huge for meters, which is why I assumed
they were square meters. But if that's your better model,
even though many of the errors are probably being overestimated, then the
variogram isn't going to look good because the theoretical curve is
expecting those large errors in the variogram and they aren't there
(because they aren't in the data). I think the more recent development versions of the package on GitHub change this behavior, and you will probably find it more suitable if you update.
If your predicted value is the median error, you definitely want to fix the RMS UERE with uere.fit() to get the right proportionality constant. You are correct that assigning a numeric value will fix the parameter.
You can't compare error model fits (on the calibration data) in situations where you assign an RMS UERE value. What you should compare is something like uere(STATIONARY_DATA_HDOP1) and
uere(STATIONARY_DATA_HDOP2), where both represent the same calibration data, but different error models.
Best,
Chris
aie...@oregonstate.edu
Jun 2, 2021, 6:51:05 PM6/2/21
to ctmm R user group
Sorry if I wasn't clear, these data have been a challenge to work with, so I've been taking some out of the ordinary approaches...
I took stationary data (13 collars with 20,240 data points) and used the distance from the median location as a response variable in a glm gamma model - our error is extremely skewed with long tail, higher than is typical for most GPS collars I've seen, more similar to Argos data. I used a number of metrics and their interactions as predictors. Some metrics were collar-reported DOP, fix type and timed out status, and others were metrics I derived, such as estimated elevation error ( |GPS reported elevation - the DEM estimated elevation| ) and a categorical flag of suspect points based on turning angles and the ratio of distance to the prior point : distance to next point (indicative of an out-and-back spiking pattern).
I found it hard to incorporate the interaction of more than just a couple variables using the ctmm package in a straightforward way, which is why I built this model externally. And interactions seemed to help because no single or even couple of metrics were coming anywhere close to capturing the error, even if I removed the most extreme cases from the stationary data before attempting to fit error models.
The top glm model did have a tendency to over-predict, and some predictions (n = 21) had such extreme values that I capped predictions that were above the 0.999 quantile to the value of the 0.999 quantile cutoff. After capping the max prediction, the mean |predicted - actual| was 53m with SD 716m, but the median |predicted - actual| was only 2.1m.
I then assigned the capped predicted distance in meters from the top glm model to the stationary data's HDOP column and ran uere.fit in ctmm, which gave that uere estimate of 1.29 and Z^2 of 1.9, and this was by far the best error model when I compared it to any other uere.fit model estimated from the stationary data using simpler combinations of the same metrics. But when I applied the approach (assign capped glm predictions to HDOP, then assign UERE estimated from stationary data) to the example animal, it produced the variogram fit with the curve extending way beyond the data .
I'll update to the github version and see what effect this has on that variogram plot.
I hope that describes what I did a little better. If you think this approach seems like a really bad idea, I'd appreciate you saying so. The error is to the scale where I think it will really affect the analyses I intended to do, and I just couldn't find a work around without removing a lot of data. I even have some out of sample stationary data that I could use in some way to validate the error model further if needed. Or combine with the data I already had and see if I'm getting the same result.
Christina
Christen Fleming
Jun 5, 2021, 4:51:40 PM6/5/21
to ctmm R user group
Hi Christina,
That all sounds pretty reasonable, and I'm glad you were able to get more velocity continuity out as a result of your effort. That is a sign of error-model improvement that is hard to get by random chance or over-fitting.
My only easy questions would be (1) Did you include an intercept term in your model? (2) Did you try modeling distance^2 and not distance?
Yeah, the current code in uere.fit() is designed for simple multiplicative terms and categorical differences that would be combined by hand, because the typical models are pretty simple. It would be a project to allow for GLM type regression in uere.fit(), though you can (and I have) run uere.fit() inside an optimizer to fit extra parameters and adjust the AICc penalty by hand afterwards. This would have some slight benefits of estimating and detrending a consistent mean with the predicted 1/variance weights and including the REML correction. But I don't think that would necessarily improve the wide range of variance predictions that you are getting.
Also, I doubt it matters much to cutoff the largest variance predictions, as those estimates essentially do not contribute much of any information to the resulting analyses anyhow. It's the under-estimated variance estimates that are more likely to give you trouble.
Best,
Chris
aie...@oregonstate.edu
Jun 7, 2021, 11:54:39 AM6/7/21
to ctmm R user group
Hi Chris,
1) I did fit an intercept in the glm models, which I guess doesn't make too much sense in this situation, because we don't really ever expect the continuous error metrics to be zero.
2) I did not try and model distance^2, do you think that might be more effective in this situation?
I understand trying to make the uere.fit function streamlined for the most common situations. I've worked with some other collar models on bighorn that don't have this extreme error problem and have had way less difficulties and find using the ctmm functions for error models generally works great.
Good to know those extreme values wouldn't have been much of a problem. I was just worried that keeping them in might somehow slow the model fitting process - kind of how centering and scaling can help with convergence. But that's just perhaps my ignorance in what affects behind-the-scenes efficiency.
I updated my version of the ctmm package to the github version and that cleared up the variogram plot issue - the fit looks much better now! Thanks for that tip.
Christina
Christen Fleming
Jun 7, 2021, 5:02:17 PM6/7/21
to ctmm R user group
Hi Christina,
1. I wanted to make sure that you did try to include an intercept term. I would.
2. The mathematical draw of distance^2 as a response variable is that if you have additive error contributions, then you get an additive variance model. But with a log link, there should be no difference. A log link would make sense if the effects are multiplicative.
Best,
Chris
Reply all
Reply to author
Forward
0 new messages