How to identify residency via SVF?
947 views
Skip to first unread message

yu lei
Mar 25, 2022, 8:49:07 AM3/25/22
to ctmm R user group
Hi Chris
Thanks so much for your reply last time.
I know the AKDE is suited for range residents, and we can determine whether an individual exhibit range residency via visual SVF with reaching asymptotes or the DOF area value.
However, I'm not sure when the variogram asympetote can indicate residency. Recently, i saw a figure (posted below ) in the preprint paper (https://osf.io/ka5t6) , it seems stable variograms have kinds of shapes, including bell, hump shapes, even some consistent upward lines which should not be stable events i think.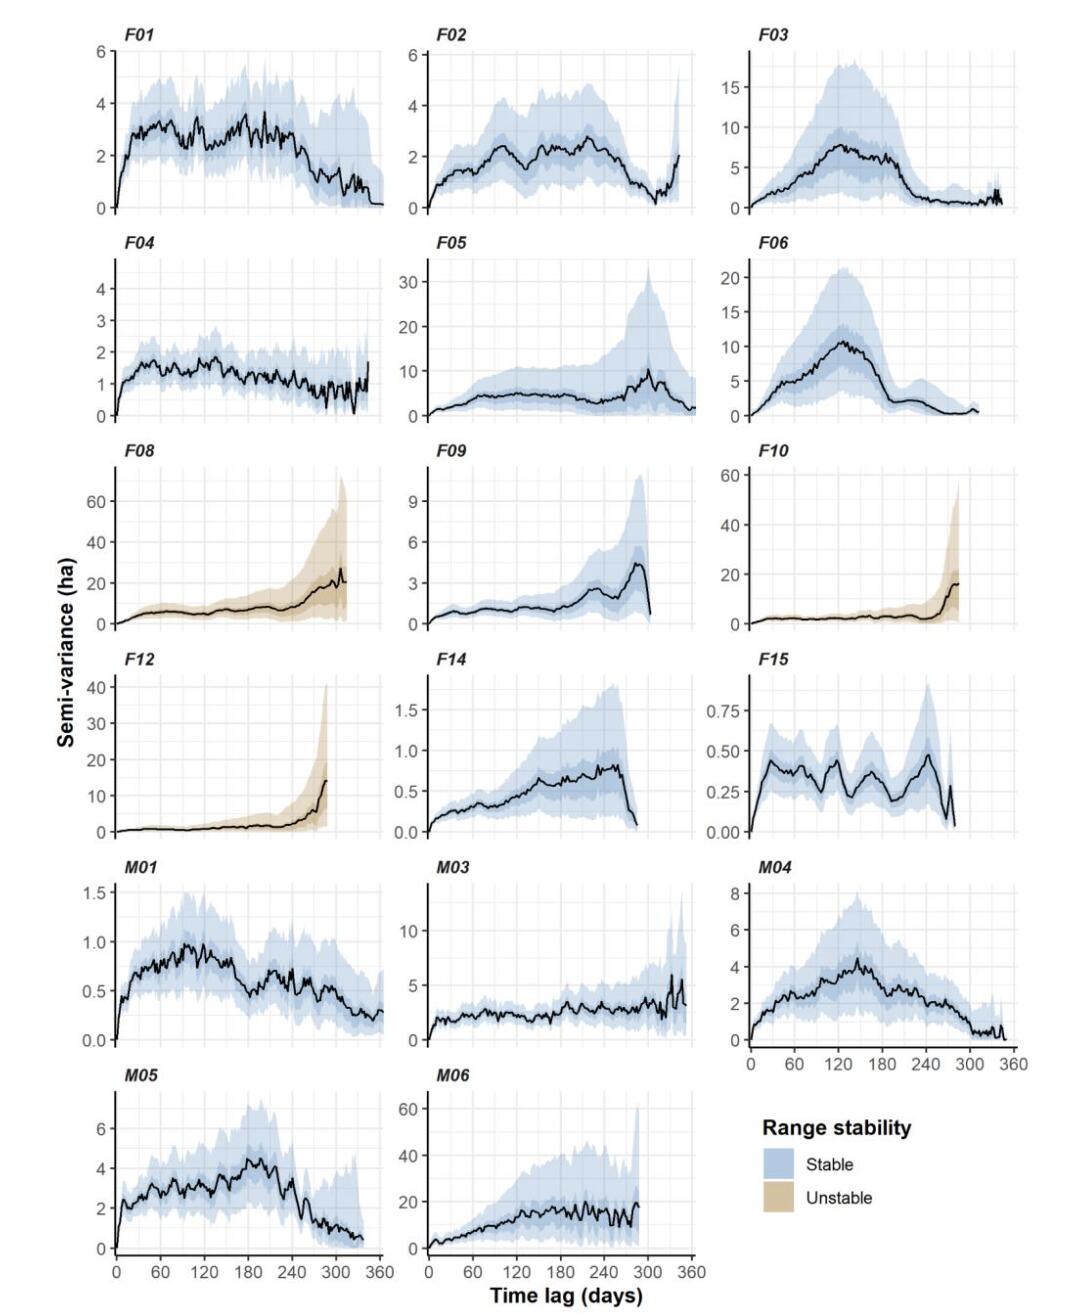
I only suppose that when the vairogram have a flatten asymptote (like a straight line) can represents range residency before, After saw the figure, i was confused about this question.
Thanks for any suggestions.
Best,
Yu Lei

Christen Fleming
Mar 28, 2022, 12:30:03 AM3/28/22
to ctmm R user group
Hi Yu Lei,
The ideal variogram of a range resident individual is one that has a flat asymptote, like F04 & M03 in the figure. However, I think that these variograms are all fully zoomed out, and the last half of a variogram is pretty erroneous, so variograms like F01 & F15 are okay too.
The highlighted variograms F08, F10, F12 are the most problematic and definitely indicate something non-resident happening.
The middling variograms, like F03 and F06 are somewhat questionable, and I would look at whether their area estimates and DOFs fall within the spread of the population.
We have a number of features to help with this identification, including
the CI="Gauss" argument to variogram() and the cluster() function, and we are testing some cross validation methods as well.
Best,
Chris

Jesse Alston
Mar 29, 2022, 11:35:18 AM3/29/22
to ctmm R user group
Hi Chris,
To build on Yu Lei's question, I've been trying to think about what the shape of the variogram will do to predictions of home range use. Consider half-sample cross-validation like was performed in Noonan et al. 2019 (
https://doi.org/10.1002/ecm.1344
). If a variogram continues to go up throughout the timeline on the x-axis, a home range estimated using the first half of a data set will consistently and greatly underestimate the number of points within that home range estimate in the second half of the data set. I think that's pretty clear. If a variogram goes down toward the end of the timeline, though, I don't think you'll get the opposite: consistent overestimation of the number of points in the test set within the home range. Is that right? I might look into this with empirical data.
Jesse
Message has been deleted
yu lei
Mar 30, 2022, 9:21:48 PM3/30/22
to ctmm R user group
Hi Chris,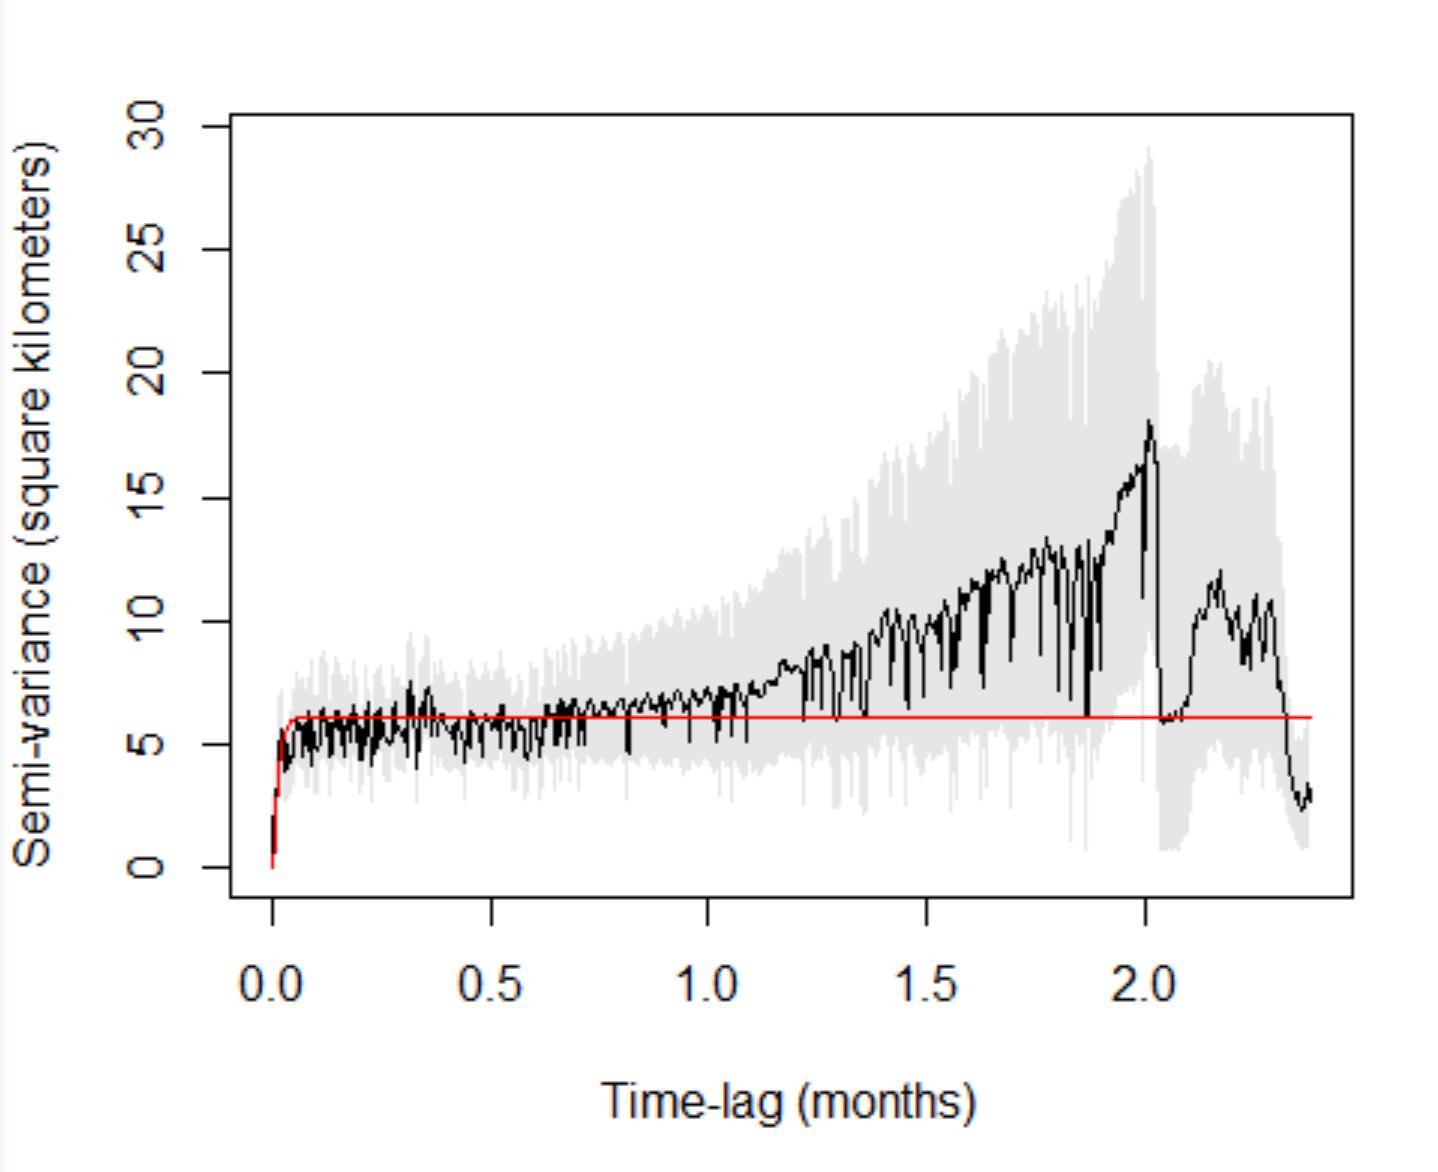

Thanks for your prompt reply. I have another two questions here.
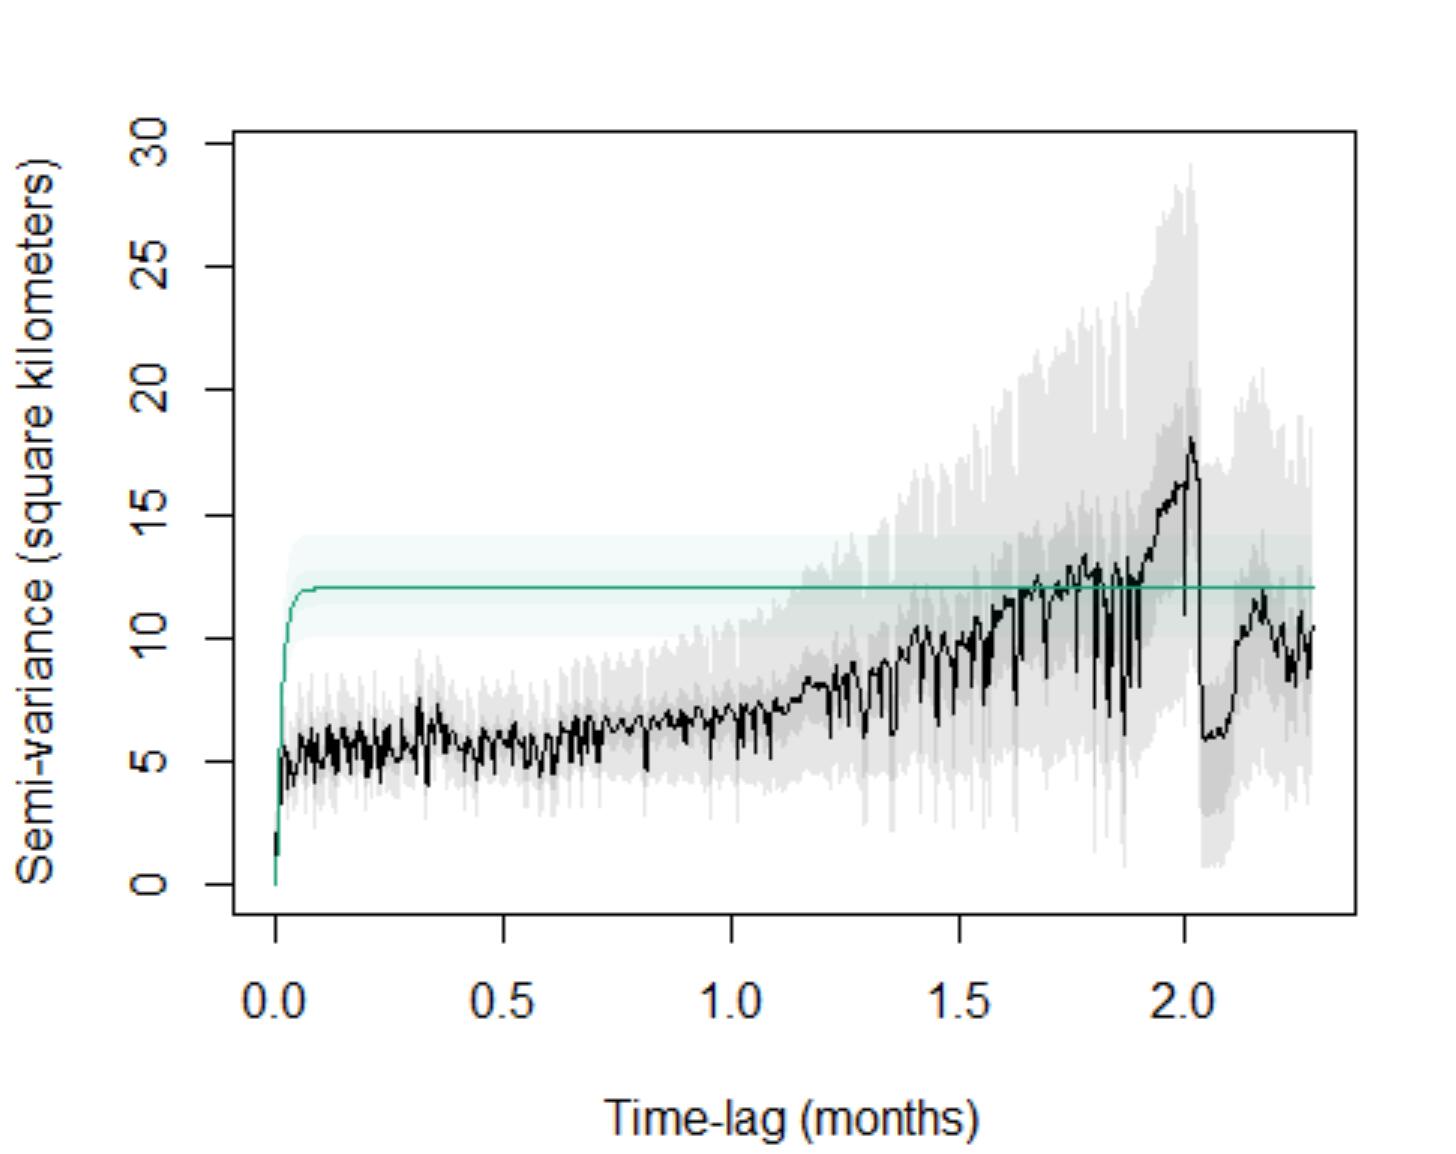
First, i find the GUESS i manually fitted (red line in below ) is different with the fitted GUESS of best model via ctmm.select (green line). Should i according to the fitted model result to estimate home range or adjusting the model GUESS until close i wished. If necessary to adjust, how to realize?
The second question is about movement parameters from ctmm.select function (see below).
Two parameter (home range crossing time (τp )and directional persistence timescale (τv )) were referred in this paper Medici 2022 (https://doi.org/10.1186/s40462-022-00313-w), does it mean τ position and τ velocity separately ?
And i confuesd on diffusion parameter which have rare interpretation before, it means movement or dispersal range per day ? if so , can i use it to quantify the movement or space use of animal individual during study period?
Thanks for any suggestions.
Best,
Yu Lei
Christen Fleming
Mar 31, 2022, 9:19:29 AM3/31/22
to ctmm R user group
Hi Jesse,
One thing to consider is that the x-axis of the variogram isn't the timeline/timestamps of the data, but different sized time lags between data points, with the maximum time lag being the total period of the data (first-to-last point), but with lesser lags occuring at different times within the period of the data.
A variogram that continues to increase without limit (like the highlighted examples) will likely underestimate future space use with any estimate based on the current data, like you say. And if this is happening on a large timescale, then it's probably some kind of dispersal phenomena taking place.
A variogram that consists of a hump could be something more like an A -> B -> A movement. This could be two crossings of a large home range, or a dispersal and return behavior, or something else, depending on the context.
Best,
Chris
Christen Fleming
Mar 31, 2022, 9:26:17 AM3/31/22
to ctmm R user group
Hi Yu Lei,
Seeing this large of a discrepancy between the empirical and theoretical (fitted) variograms suggests that there is some non-stationary behavior in the data that needs to be taken into account. I would look to see if the data needs to be segmented at some time(s) because of a range shift or dispersal event of some kind.
The tau parameters are as you have noted. The diffusion rate parameter is new and will be described in an upcoming paper. I introduced this for people to be able to quantify a rate of movement in data that are too coarse for speed estimation, but not so coarse that they are IID.
Best,
Chris

Soham Mehta
Sep 22, 2023, 1:23:47 PM9/22/23
to ctmm R user group
Hi Chris,
Hope you are well!
I have been seeing other people's doubts about meeting the range residency assumption. However, I wanted to confirm somethings about some of my variograms.
1. If an asymptote is observed and then the line is trending upwards towards the very end would I need to trunicate the data further. I ask this because (a) some of the dogs already have only a few days of data (e.g. 20-40 days),(b) I have already subsetted the data into seasons (summer, winter, monsoon) to showcase different distributions (c) we know that free-ranging dogs do not really 'migrate' but may frequently foray and may visit specific sites repeatedly where they might be a food source. So if I were to remove those locations it would affect my habitat selection (2nd order) analysis. So in the case of dogs with low sampling time and an increasing trend in the end, should I just use those estimates and report the trend observed? What would you recommend?
2. Some of them tend to have a decreasing trend in the second half of the empirical variogram. What do you advise I do about those?
3. I used the ctmm.guess & ctmm.select fucntions to fit the movement model. However, the movement model fit seemed a little weird for a select few which I have posted. How can I change that so it is more accurate?
Thank you in advance,
Soham Mehta
Christen Fleming
Sep 22, 2023, 2:23:15 PM9/22/23
to ctmm R user group
Hi Soham,
In the cases where there is a clear separation between the selected model's theoretical semi-variance and the data's empirical variogram, outside of the CIs, I would definitely look to segment the data.
As for estimating 2nd-order selection versus 3rd-order selection, with the present kinds of RSF models, I think you need to do that in two stages or at two levels, with the home-range centers and foray locations sampled from a separate process. I think, data-wise, that's probably going to be very hard to do without multiple individuals, but I'm working on some functional response code at the moment when using mean() on multiple RSFs.
Best,
Chris
Soham Mehta
Sep 22, 2023, 2:50:23 PM9/22/23
to ctmm R user group
Hi Chris,
Thanks for the message! So if I am getting this right, the variograms I attached above are fine to go ahead and I do not really need to segment the data any further even though at the very end they are increasing? Because we do believe that these dogs do not migrate. Do you recommend just reporting this trend and moving ahead with the analysis?
Also, I am planning to use compositional analysis at the 2nd order selection only at this point in time.
Thanks always,
Soham Mehta
Christen Fleming
Sep 22, 2023, 7:15:45 PM9/22/23
to ctmm R user group
Hi Soham,
Some of the variograms at the end do look pretty far off from the models.
Best,
Chrsi
Soham Mehta
Sep 22, 2023, 7:22:21 PM9/22/23
to ctmm R user group
Hi Chris,
Got it, are you talking about the last three? I will try to play around with them and see if I can make a better model fit.
I am assuming the rest of the example look fine to go ahead with?
Thanks,
Soham Mehta
Christen Fleming
Sep 22, 2023, 7:34:25 PM9/22/23
to ctmm R user group
Hi Soham,
The last 4 variograms have a noticeable difference between the asymptotes. I would look at segmenting all of those.
Best,
Chris
Soham Mehta
Sep 22, 2023, 7:44:32 PM9/22/23
to Christen Fleming, ctmm R user group
Hi Chris,
Sounds good! I just wanted to confirm since some of my variograms (the ones with the increasing trend) looked like the 'unstable' tagged variograms in Montano et al., (2022). I was just afraid that I was doing something wrong by not doing anything to that trend in the end.
Is there a function which would help identify the point(s) in the variogram where an individual changes its behavior from residency to becoming a migrant.
Best,
Soham Mehta
--
You received this message because you are subscribed to a topic in the Google Groups "ctmm R user group" group.
To unsubscribe from this topic, visit https://groups.google.com/d/topic/ctmm-user/6W5dl8RKxeU/unsubscribe.
To unsubscribe from this group and all its topics, send an email to ctmm-user+...@googlegroups.com.
To view this discussion on the web visit https://groups.google.com/d/msgid/ctmm-user/3996193b-01c6-42e1-95fc-5e77b241eb11n%40googlegroups.com.
Christen Fleming
Sep 22, 2023, 7:56:11 PM9/22/23
to ctmm R user group
Hi Soham,
I wouldn't worry about the very end of the variogram, as that part lacks confidence. I would worry about the asymptotes not matching up like the last 4. That usually means that the process changed and the variance of multiple behaviors is larger than the variance of the individual behaviors.
You can't identify absolute times from the variogram (only lengths of time or time lag). For segmenting like that, I would recommend clustering algorithms like kmeans, kmedians, and segclust2d.
Best,
Chris
Soham Mehta
Oct 7, 2023, 5:01:12 PM10/7/23
to ctmm R user group
Hi Chris,

Thanks! Hope you are doing well!
I have a few 'weird' movement model fits which I am trying to fix. Is segmenting the data the only option usually? For example, see Dog 27 (1st is default zoomed, 2nd 100% zoomed out, 3rd is the selected movement model fit, 4th is the home range contour).
I am afraid of segmenting the data further because some of the dogs in a few seasons have limited data (few days). Let me know what would you suggest to do in such cases. If I am not able to do anything much about it, I think I would just exclude them (12 out of the 75 seasonal home ranges have a weird model fit).
Best,
Soham Mehta
Christen Fleming
Oct 7, 2023, 8:13:31 PM10/7/23
to ctmm R user group
Hi Soham,
The variogram does look like there was a moderate shift at one end of the data (beginning or end). Either segmenting or a sliding window analysis would be the way to go, if you want to fix that.
Why would segmenting have to impact the smaller datasets, necessarily? Either they will look resident or they won't.
Best,
Chris
Soham Mehta
Oct 7, 2023, 8:36:55 PM10/7/23
to ctmm R user group
Hi Chris,
Thanks for the reply! How would sliding window analysis fix it, and how would you do that?
On what basis would I segment the data though?
Sorry, if these questions have been asked before!
Best,
Soham Mehta
Christen Fleming
Oct 7, 2023, 10:03:07 PM10/7/23
to ctmm R user group
Hi Soham,
You make a loop over times and for each window of time (of a width that you specify), you calculate the estimates.
We have a computer-science/data-science RA working on some general purpose code for this task, but I have no ETA for that, at present.
Best,
Chris
Soham Mehta
Oct 7, 2023, 10:10:43 PM10/7/23
to ctmm R user group
Hi Chris,
By any chance, would you have an example code which I could try running?
Thanks!
Soham Mehta
Christen Fleming
Oct 8, 2023, 7:15:29 PM10/8/23
to ctmm R user group
Hi Soham,
I do not, but its just a for loop over times.
Best,
Chris

jasone...@aol.com
Dec 12, 2023, 10:15:03 AM12/12/23
to ctmm R user group
Hey Chris,
Just wanted to ask if any of those cross validation methods you mentioned have been added to the package since the original post. I'm in the same situation, trying to exclude non-range resident organisms from my dataset, and I'd love to find a more quantitative method that isn't so reliant on my own visual judgement if that exists. Thanks!
best,
Jason
Christen Fleming
Dec 12, 2023, 9:26:44 PM12/12/23
to ctmm R user group
Hi Jason,
The cross validation model selection method actually did get implemented, but it didn't perform well in testing, so I never advertised it.
Some of the other features mentioned in this thread are in active development at this time.
New features can always be tracked in the NEWS file: https://github.com/ctmm-initiative/ctmm/blob/master/NEWS.md or by news(package='ctmm')
Best,
Chris

Alexia Le Floch
Mar 1, 2024, 6:38:59 AM3/1/24
to ctmm R user group
Hi Chris,


Alexia
I hope you're doing well. I've followed your
Animove course and applied the script used by Montano et al, (2022) to
my data for which I've attached variograms and area estimates below.
I
have highlighted what appear to be non-resident individuals: the
asymptote is not reached and the semi-variance continues to increase. Do
you confirm the non-residence of these individuals? However, as you
mentioned the erroneous side of the
last half, I have the
impression that on the first half of the variogram, if I zoom in, we
could maybe see an asymptote...
Also, I wonder if it makes sense to compare home
ranges of individuals whose selected movement model (using AICc to select
the best-fitting movement model for each individual) is different between
individuals (IID, OU, etc)?
Thanks in advance,
Jesse Alston
Mar 8, 2024, 11:25:00 AM3/8/24
to Alexia Le Floch, ctmm R user group
Hi Alexia,
All of these look OK to me. The weird tails at the end of some of them are likely from small sample sizes.
Yes, you can compare home ranges of individuals with different movement models, as long as they are range-resident.
Jesse
--
You received this message because you are subscribed to the Google Groups "ctmm R user group" group.
To unsubscribe from this group and stop receiving emails from it, send an email to ctmm-user+...@googlegroups.com.
To view this discussion on the web visit https://groups.google.com/d/msgid/ctmm-user/73c7c076-08a8-4840-b973-a6be14779622n%40googlegroups.com.
--
Jesse Alston
Mar 8, 2024, 11:38:42 AM3/8/24
to Alexia Le Floch, ctmm R user group
If you are concerned about these, you can annotate the points in your suspect models by color to see if the track moves to a different place over time. A bell-shaped variogram could indicate a seasonal migration with two distinct seasonal ranges, and a sharp upward tail at the end could indicate an abrupt shift in a home range well into a movement track, so I would check for these situations in particular.
Jesse
Christen Fleming
Mar 10, 2024, 10:45:36 PM3/10/24
to ctmm R user group
I concur with Jesse. At the end where the variogram shoots up, the CIs also become very wide. You can still imagine an asymptote running through the CIs. The errors in variograms (and ACF and MSD) are correlated, so trends that can fit within the CIs aren't necessarily meaningful.
You will also get a better sense when you fit models to the data and compare the empirical variograms to the theoretical variograms.
Best,
Chris
Reply all
Reply to author
Forward
0 new messages