Weird pattern in variogram
76 views
Skip to first unread message

Wouter Waenink
Apr 5, 2023, 8:43:03 AM4/5/23
to ctmm R user group
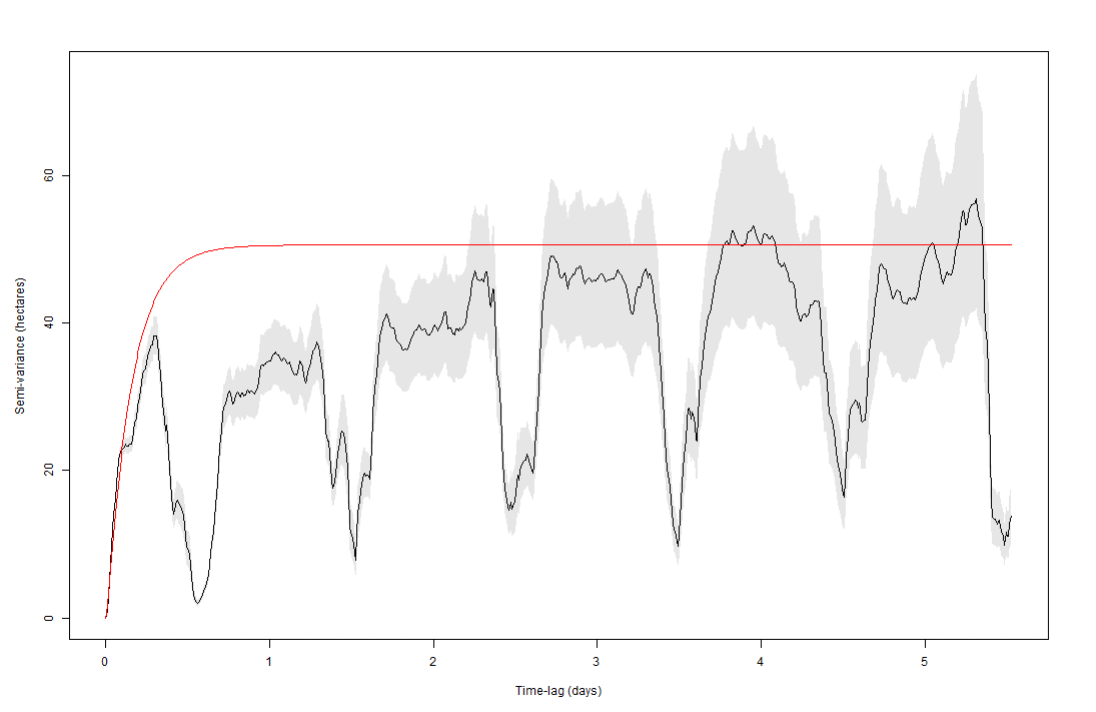
I'm working with data from pine and stone marten, but when trying to make a variogram I get a weird pattern (see attached picture) where semi variance goes down once every day. This seems to also make ctmm.guess assume it reaches independence faster than it actually should. I can think of two reasons why this would be happening.
The first is that the animals return to the nest every day which could cause the drop in variance every day since the animal is getting closer to its original position.
The second reason is that the tracker would be turned off during the day time effectively giving a time interval of half a day once every day, but I forgot how I reasoned this could cause this pattern and I'm not sure if this makes any sense.
Does anyone know if either of these explanations are likely? And is there any way I could get a usable output from ctmm.guess for a RSF?

Christen Fleming
Apr 5, 2023, 4:35:06 PM4/5/23
to ctmm R user group
That's to be expected if you have a periodic return to the den or gaps in the data. You do want to make sure that you segment the data between inside and outside of the den, if duty cycling the collar isn't completely doing that, but otherwise this guess is fine. The guess doesn't need to be perfect, it just needs to be in the ballpark. You can also use the dt argument of variogram() to clean things up a little bit.
Best,
Chris
Wouter Waenink
Apr 14, 2023, 5:38:46 AM4/14/23
to ctmm R user group
Thanks for the answer!
Reply all
Reply to author
Forward
0 new messages