Workflows for large datasets/comparing datasets with different resolutions
497 views
Skip to first unread message

steveh...@gmail.com
Feb 17, 2021, 3:52:02 PM2/17/21
to ctmm R user group
Hi Chris,
I am embarking on some analyses of rather large datasets of Mojave tortoise telemetry and I had a few questions. My goal is to do a similar analysis to the work you did with Roy's Sonoran Tortoise data, comparing HR overlap within and between individual tortoises. I have at least three years of data for > 1000 tortoises spread across a few focal areas.
In my prior workflow with the package, I separated the datasets into years and ran through my script with them. I would then export the results and do it again with the next year etc. This was primarily to help deal with the lengthy time/RAM it takes to fit models to the GPS logger data that we have for some animals. I have access to a more powerful computer now so I was wondering if you had tips on data/list organization for multiple years of data at the same time. I expect that I'll still be separating them by focal areas.
The datasets I have are of different temporal resolutions. Some have monthly, some weekly tracking, some biweekly, some have hourly GPS logger data. Is there a way to account for the differences in information provided by each set for the overlap analyses?
Finally, I do have some dispersals/sallies in the datasets. I've mostly identified the dispersals using a much cruder metric, but most of the sallies are only evident in the GPS logger data so I don't have them quantified yet. Do you have any recommendations for dealing with these?
Thanks for making this package, and for providing all this assistance!

Christen Fleming
Feb 17, 2021, 5:14:46 PM2/17/21
to ctmm R user group
Hi Steve,
I find that RAM isn't an issue unless making very detailed distributions for plotting. To save computation time, I recommend making a for loop over individuals and then upgrading that to a foreach loop to parallelize over CPU cores.
Continuous-time methods are made exactly for challenges like having different temporal resolutions. So don't worry about it. Uncertainties will propagate through the confidence intervals.
For manual inspection, you might look at these functions: https://ctmm-initiative.github.io/ctmm/reference/select.html
For something more automated/objective, you might consider the segclust2d package.
Best,
Chris
steveh...@gmail.com
Apr 1, 2021, 3:59:06 PM4/1/21
to ctmm R user group
Thanks Chris!
Sorry I have to break this up into multiple messages, I can't seem to post it as one.
I think I have my workflow set up now to allow for
the outputs I want, but there is a few small things I was wondering if
you maybe help with. Sorry in advance for the long post!
I
am using an lapply to perform the ctmm.select() as below, where the
telemetry object is split into annual tracks for each individual:
trial_ctmm <- lapply(1:length(trial_telemetry), function(i) ctmm.select(trial_telemetry[[i]], trial_guess[[i]], cores = 7,level = 1, verbose = F, trace = 1))
I
haven't been able to figure out how to extract the name of the best
model that is selected by doing this method; when I was doing a mapply
for this step I was able to by getting the names() of the object.
However, I can't seem to have aligned AKDE for each individual with the
output of the mapply (as I want to determine overlap across years for
each individual's annual HR). I can get an idea of which one was chosen
by my variogram outputs, but that doesn't help with reporting the
results. I also get this warning occasionally, though I'm never sure
which year it refers to:
Warning messages:
1: In ctmm.fit(data, GUESS, trace = trace2, ...) :
pREML failure: indefinite ML Hessian or divergent REML gradient.
1: In ctmm.fit(data, GUESS, trace = trace2, ...) :
pREML failure: indefinite ML Hessian or divergent REML gradient.
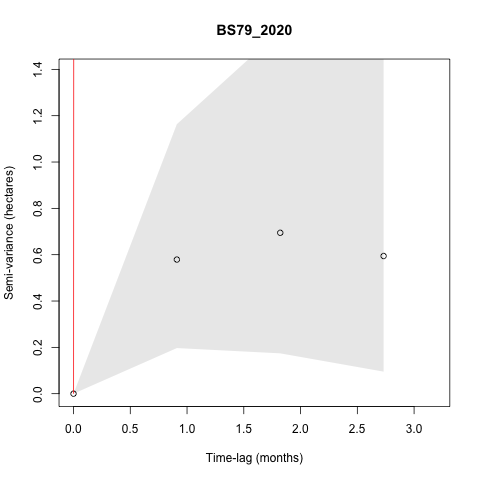
I am getting a few weird fits in the models, such as seen below:
This
is typically happening when the tracking frequency was reduced to
monthly on these individuals, but I was wondering if it should be
something I need to be concerned about with respect to the AKDEs that
are generated.
steveh...@gmail.com
Apr 1, 2021, 4:01:35 PM4/1/21
to ctmm R user group
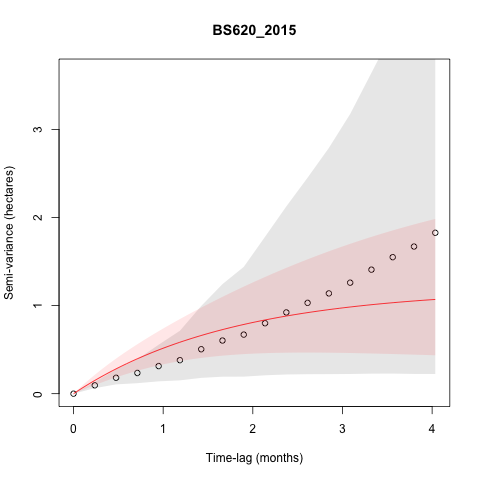
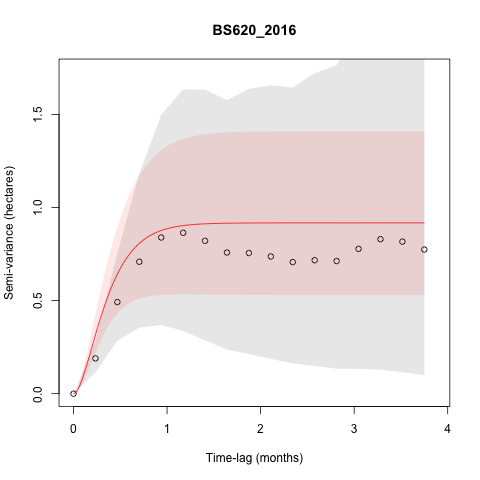
I am also getting some individuals that don't appear
to be range-resident based on the variograms, but don't seem to be
making dispersal/sallies outside of areas they used in other years. Some
of these are tortoises interacting with a newly constructed fence that
is likely preventing them from moving back into areas they used to use,
but some (such as below) are not. This individual (BS620), did not
appear to make any exploratory sallies in 2015, though it appears to
have in 2016, but this isn't reflected in the variograms. None of the
other years of data for this individual look particularly suspicious,
though some of them fit with an IID model. I am interested in how these
sallies change space use and potentially social interactions between
individuals, so should I go and take out the points of the sally that I
identified despite it not being indicated as non range-resident in the
variogram?
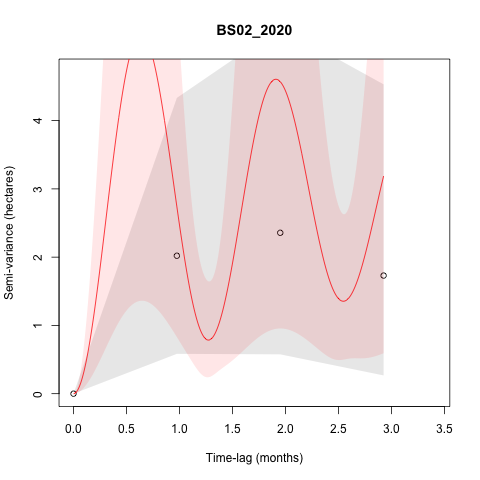
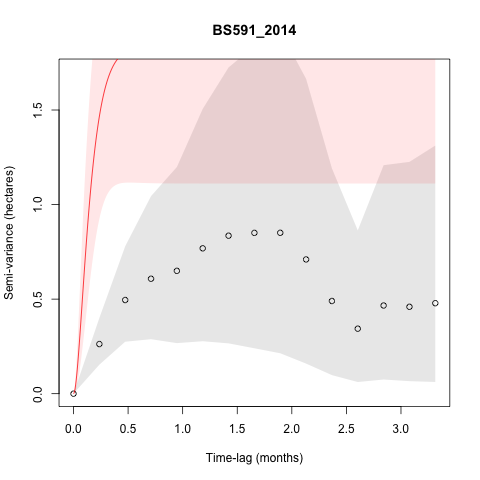
I also get some individuals that have models with really high
semi-variance that doesn't seem to align with the variogram, such as:
steveh...@gmail.com
Apr 1, 2021, 4:02:33 PM4/1/21
to ctmm R user group
When creating SpatialPolygonDataFrames for each annual HR, I run into some issues with a few animals, and the error
Error in .spTransform_Polygon(input[[i]], to_args = to_args, from_args = from_args, :
failure in Polygons 3 Polygon 1 points 611
failure in Polygons 3 Polygon 1 points 611
Is
returned when I try to spTransform() from the +tpeqd to the UTM
projection we use. I believe this is because some of the low estimated
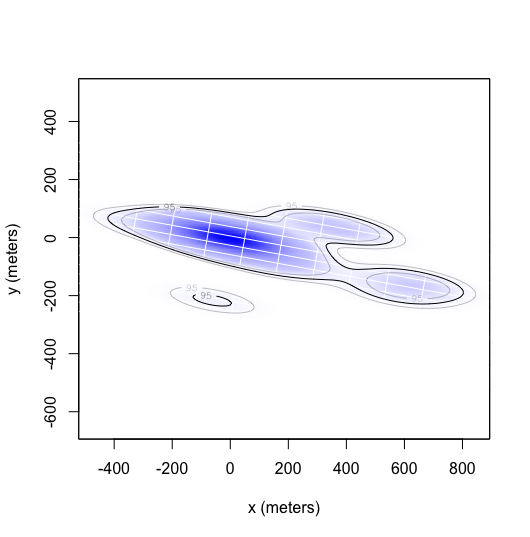
part of the HR isn't a valid polygon. This is an example of an akde that
results in this error, I think that the small area in the bottom of the
plot is causing the issue. I don't necessarily need all the SPDFs, so
this isn't a pressing issue.
One final question: I was wondering if there is a more elegant way
to handle the outputs of the overlap() function. I coded up some
convoluted for loops that do mostly what I want but I'm sure there is an
easier way I am missing.
Thanks again for all your assistance!
Christen Fleming
Apr 3, 2021, 2:48:56 PM4/3/21
to ctmm R user group
Hi Steve,
The output models should be ordered from best to worst, according to the IC. So the first model should be the selected model. I will update the documentation to be more explicit. The list (with verbose=TRUE) should be named. summary() should also report the name as well, either individually or on lists.
The warning is referring to parameter estimation quality. When you have parameters within uncertainty of boundaries, the pREML step can fail.
I'm guessing the model fit in the plot is OUO, and you had a small track of central place foraging data where the tortoise kept returning to a burrow? I wouldn't worry about that too much, but you can try a more stringent information criterion with smaller amounts of data if you want.
Best,
Chris
Christen Fleming
Apr 3, 2021, 2:53:45 PM4/3/21
to ctmm R user group
A small number of short sallies won't necessarily produce a large deviation from range residence. Other behaviors can also violate residence, such as range shifts. I would plot
BS620_2015 with the locations colored by time to inspect further.
In the last two examples, I would try zooming the variogram out and seeing if there is a big upwards trend in the variogram at the end, which can also indicate a big range shift.
Best,
Chris
Christen Fleming
Apr 3, 2021, 2:56:47 PM4/3/21
to ctmm R user group
If you can provide me with a minimal working example (data and script), then I will look into the error and make sure its fixed.
I don't know what you mean by handling the outputs, but there is a plotting function in ctmmweb that you can access from the command line.
Best,
Chris
steveh...@gmail.com
Apr 11, 2021, 8:48:44 PM4/11/21
to ctmm R user group
Thanks Chris!
I'm sending you some code/example data but I figured I'd reply here as well in case it can help someone else.
I think my issue with getting the model names stems from the way I have been using lapply to do the ctmm.select() call. If I include verbose =T, I get this error:
Error in akde(trial_tl, trial_ctmm) : CTMM argument is of class list
when I try to use the akde function with the output. My prior workflows where I didn't want the akde's to be aligned across each year for each animal had no problem getting the best model with the names() call. I tried to figure out the difference in structure between verbose=T and F calls, but I couldn't find where the model name was in the result of the verbose = F call. Calling summary on the verbose = F call result works though!
Plotting out farther helps confirm the range residence for these individuals. Not sure if we can really identify is there was central-place foraging vs. social interactions with the resolution of this dataset, but that could be the case. This dataset was collected with a somewhat variable temporal resolution.
What I meant by the outputs is the pairwise comparisons that are produced by the output() call. I wanted to turn them into a dataframe for each pairwise comparison for a boxplot to show how much variation there is in annual home range overlap across all the non dispersing individuals. I'll look into the visualizations in ctmmweb and see if that helps.
Christen Fleming
Apr 12, 2021, 5:05:19 PM4/12/21
to ctmm R user group
Hi Steve,
I'll look at the MWE in the next couple of days.
ctmm.select() with verbose=TRUE returns a list, and you just want the first element of that list (the highest ranked model) for further analyses like akde(). verbose=FALSE only returns the highest ranked model. Not being in a list, the object would have whatever name you gave it, but summary() will tell you its canonical name.
If they do appear resident with asymptoting variograms, then with the discrepant model fits, another thing you would want to check is for outliers, such as with the outlie() function, including times sampled very close together without an error model, which then produce speed/diffusion outliers.
Best,
Chris
Christen Fleming
Apr 13, 2021, 9:41:36 PM4/13/21
to ctmm R user group
Hi Steve,
It looks like you are attempting to simultaneously fit the location error with no calibration nor prior (nor DOP values) on a small amount of data. This is super risky and I don't recommend it.
On the very first individual in the loop, the selected model is really bad, with no certainty in the movement nor error variances, and if you compare to the same model but with no location error, then model selection does not support the error parameter that you are trying to simultaneously estimate. Either the data looks like all movement or all error with no distinction between the two supported. I didn't check further, but I would not be surprised if there are problems downstream from this output, because the numbers are crazy (and not supported by the data).
I would try to fix the error models first, either with calibration data or by supplying a prior (now possible in the development version of the package on GitHub—see the updated vignette: https://ctmm-initiative.github.io/ctmm/articles/error.html ) and also seeing if you have anything in the data like a DOP value or number-of-satellites ( https://www.biorxiv.org/content/10.1101/2020.06.12.130195v1 ) to assist in the performance of the error model. This can also help with the mismatch of the empirical and theoretical variograms, if you calibrate the data before calculating the variogram and set error=TRUE there and in the later modeling.
If you run into any further issues, please let me know.
Best,
Chris
On Sunday, April 11, 2021 at 8:48:44 PM UTC-4 steveh...@gmail.com wrote:
steveh...@gmail.com
Apr 14, 2021, 9:29:44 PM4/14/21
to ctmm R user group
Ah thanks Chris!
I think I misunderstood what the error=3 call I used in the ctmm() was doing, and when it was appropriate to use. All the data I sent you is VHF telemetry. We didn't get an accuracy column from the data collectors, so I assumed that this error value might be a good thing to include.
Should I not try to quantify error on purely VHF data taken with a handheld GPS?
Some of the other datasets I'm working with include both VHF and GPS logger data. I plan on getting some calibration data this season on our loggers, but often when we can't handle a tortoise (when it won't come out of its burrow) and the tortoises lose their loggers, we only have a VHF point for that month so for many individuals we will need to include both.
Christen Fleming
Apr 15, 2021, 4:59:25 PM4/15/21
to ctmm R user group
Hi Steve,
error=3 in ctmm.guess(...,CTMM=ctmm()) will set an initial guess of 3 meter error, but the error will ultimately fit from the data (which is here extremely risky and has poor results). uere(DATA) <- 3 will fix the location error to 3 meters (RMS) exactly. The updated vignette I linked to has an example with a prior, so that you can give that some uncertainty. You could probably try to infer something about the GPS units and reception in the desert should be pretty good.
Do you mean a triangulated VHF point for the latter? That should come with an error ellipse, which you can import and use. You just have to give it the same format as Argos data.
Best,
Chris
steveh...@gmail.com
Apr 15, 2021, 5:57:57 PM4/15/21
to ctmm R user group
Hi Chris,
Thanks for that explanation!
The data aren't from triangulated VHF points, but from points taken on a handheld GPS at the location of the tortoise. We use GPS loggers that require a swap in units every month, so there is often missing months of data when we can't handle the animal or the logger has been shed. So on some individuals, we have data where there might be two months of no GPS logger data, but a single point for when the animal was tracked.
Steve
Reply all
Reply to author
Forward
0 new messages