Replication of plots from exact p-value paper

Jordan Force
- Use the generate-peptides utility to digest the yeast proteome with a trypsin/p setting, and "--keep-terminal-aminos none" so that the terminal positions get shuffled when creating the decoys
- Convert the generate-peptides.decoy.txt file to FASTA, and call tide-index to create an index from it. I use the "--decoy-format none", since we don't need to make a second set of decoys here. Since I don't need to digest again, I use "--custom-enzyme '[Z]|[Z]' --enzyme custom-enzyme".
- Search the yeast MGF file using "--exact-p-value T --top-match 10000000", so that all matches would be outputted for each scan
- Use a script I wrote to pick a random match for each spectra in the output generated above, and plot the log p-value vs log p-value rank
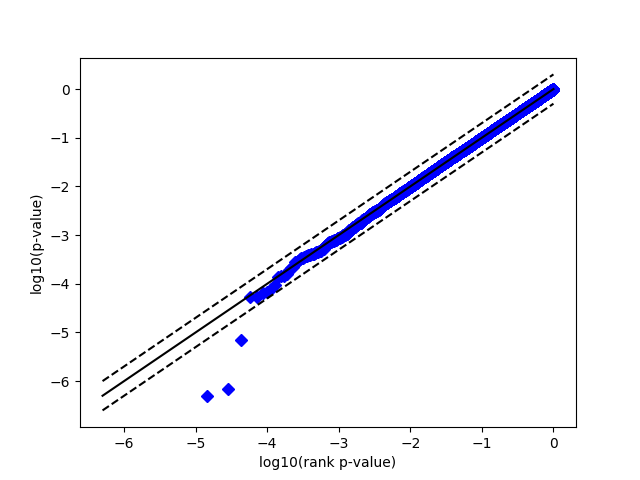
This is much closer to being uniform than figure 4B in the paper. What am I doing differently? I recognize that this paper is a few years old, so some of the details may have been lost to time. However, any advice you could provide would be extremely helpful.
By the way, for the second step, the tide-index documentation says to use '{X}|{X}' to prevent digestion. I tried this, but I get "FATAL: No target sequences generated. Is '...' a FASTA file?"; using '[Z]|[Z]' doesn't cause this error, and it prevents digestion (based on the tide-index.peptides.targe.txt file created by tide-index). I'm using crux 3.1.
Thanks,
Jordan

William S Noble
--
You received this message because you are subscribed to the Google Groups "crux-users" group.
To unsubscribe from this group and stop receiving emails from it, send an email to crux-users+...@googlegroups.com.
To view this discussion on the web visit https://groups.google.com/d/msgid/crux-users/f273800e-6941-4c51-af95-e8e4013d4f6f%40googlegroups.com.

Andy
Jordan Force
Jordan Force
Hi Jordan,I don't think it's possible to reproduce the behavior shown in Figure 4 without modifying the source code of Crux. The difference between the panels has to do with how the background probabilities associated with individual amino acids are calculated. In the current version of Crux, we use the different backgrounds (N-term, C-term, other) and don't provide the user with a way to modify that behavior.Incidentally, I don't think it's necessary to do the first half of step 4 (randomly picking one p-value per spectrum). All of the p-values should be randomly distributed, so you should get a roughly uniform distribution with or without that step.Bill
On Thu, Feb 20, 2020 at 6:28 AM Jordan Force <jorda...@uconn.edu> wrote:
Hi everyone,--This question is more for Bill Noble and Jeffry Howbert, but I thought it would be reasonable to ask it on the mailing list. I'm trying to replicate the results of figure 4B in the paper about computing p-values with XCorr (https://www.ncbi.nlm.nih.gov/pmc/articles/PMC4159662/pdf/zjw2467.pdf). There, they plot p-value against p-value rank for 10,000 random decoy PSMs from the yeast dataset, and find that the p-values are not uniformly distributed when identical abundance estimates are used at all peptide positions. However, I'm getting pretty different results -- the p-values I get are fairly uniform. I can go into more detail about how exactly I tried to replicate, but this is my strategy:
- Use the generate-peptides utility to digest the yeast proteome with a trypsin/p setting, and "--keep-terminal-aminos none" so that the terminal positions get shuffled when creating the decoys
- Convert the generate-peptides.decoy.txt file to FASTA, and call tide-index to create an index from it. I use the "--decoy-format none", since we don't need to make a second set of decoys here. Since I don't need to digest again, I use "--custom-enzyme '[Z]|[Z]' --enzyme custom-enzyme".
- Search the yeast MGF file using "--exact-p-value T --top-match 10000000", so that all matches would be outputted for each scan
- Use a script I wrote to pick a random match for each spectra in the output generated above, and plot the log p-value vs log p-value rank
This is the plot I get:
This is much closer to being uniform than figure 4B in the paper. What am I doing differently? I recognize that this paper is a few years old, so some of the details may have been lost to time. However, any advice you could provide would be extremely helpful.
By the way, for the second step, the tide-index documentation says to use '{X}|{X}' to prevent digestion. I tried this, but I get "FATAL: No target sequences generated. Is '...' a FASTA file?"; using '[Z]|[Z]' doesn't cause this error, and it prevents digestion (based on the tide-index.peptides.targe.txt file created by tide-index). I'm using crux 3.1.
Thanks,
Jordan
You received this message because you are subscribed to the Google Groups "crux-users" group.

To unsubscribe from this group and stop receiving emails from it, send an email to crux-...@googlegroups.com.