The confusing of the results of DOS calculated by cp2k (the Fermi level is not in the band gap)
1,538 views
Skip to first unread message

zhj...@gmail.com
Aug 4, 2017, 8:52:39 AM8/4/17
to cp...@googlegroups.com
Dear CP2K Users/Experts,
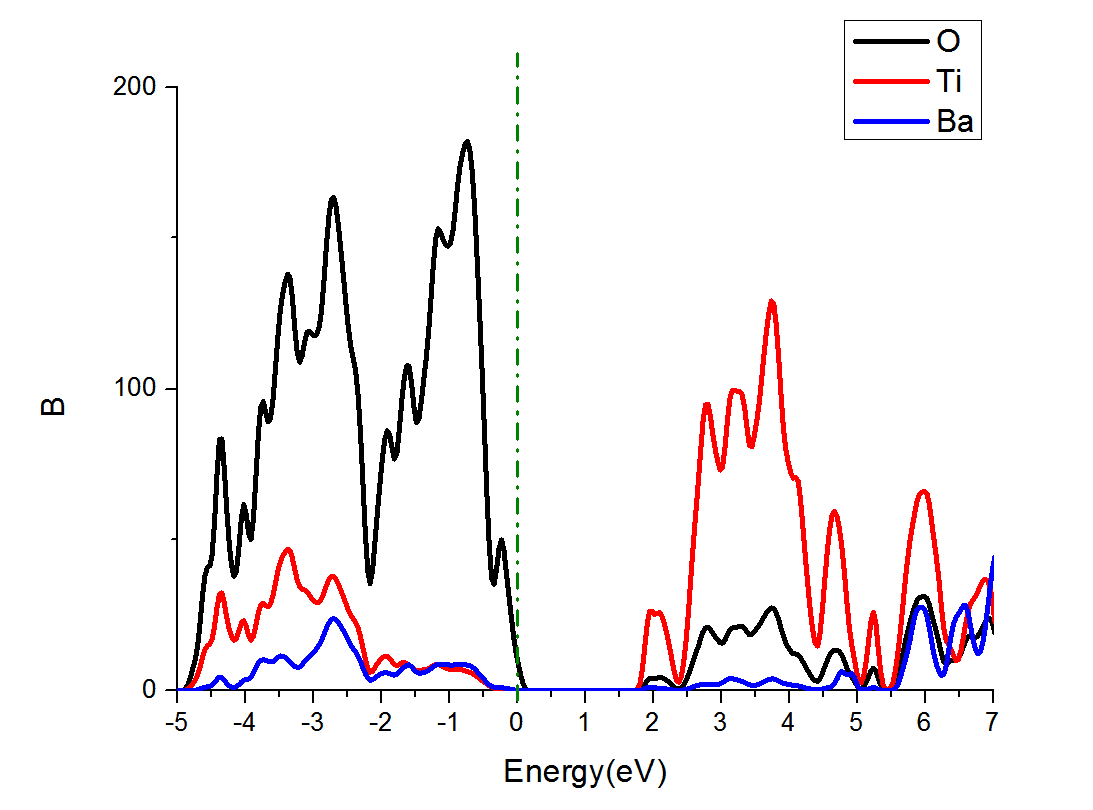
I was used CP2K with HSE06 and gamma point to calculate the DOS of BaTiO3(contain 625 atoms, 19.96*19.96*20.18 A^3 ), but the results is confused. BaTiO3 is the insulator, but the Fermi level is not in the band gap. The system is optimized using GEO_OPT. So, can anyone tell me what's going on?
Regards,
Zhjs

Matt W
Aug 4, 2017, 9:40:36 AM8/4/17
to cp2k
Hi,
if you are not using mixing, cp2k reports the fermi level as that of the HOMO (or valence band maximum if you prefer). At 0K, the fermi level can be anywhere in the band gap.
You are applying some broadening when you plot the dos, so it looks like the fermi level is just below the band edge.
Matt
Matt W
Aug 4, 2017, 10:50:38 AM8/4/17
to cp2k
Hi,
there is not a problem.
CP2K reports the fermi level at the same energy as the HOMO. Your smearing-pdos script broadens the energy of the highest level so it looks like there is DOS slightly above the reported fermi level. But this is just an artifact of the broadening applied for plotting - e'd guess this might be set by the 'ww = 0.08' in your script - try reducing this and see.
Matt

Rizwan Nabi
Jan 16, 2018, 12:53:13 AM1/16/18
to cp2k
Dear
I am also trying to get clear pdos plot from the cp2k consultations but i am facing some problems. Would you please tell me how you get all the three i.e k1, k2 and k3 in one plot together, since program prints here in your case all the three pdos separately for individual atoms, similarly in my system five pdos files are printed, as my system is having 5 different atoms. Now i am bit confused how to get total pdos plot showing all the plots in one plot only. I am attaching pdos snapshot that i have got, please suggest me how to make it more clear and appealing. i have smeared them all and then plotted in origin-8.0 software.
Rizwan Nabi
Jan 17, 2018, 1:13:57 AM1/17/18
to cp2k
Hi Matt W
I have a very basic question regarding the PDOS in cp2k. How can we find out whether the Fermi level is shifted in PDOS file? And second question is that how can we say that Fermi level is shifting either towards +ve region or negative region in the PDOS plot? I have PDOS plot but i am not able to find out Fermi level. Can you help me in this regard? I am attaching snapshot of the PDOS plot also.
Inconvenience caused is regretted!
Reply all
Reply to author
Forward
0 new messages