CTP-Tau Joint Histograms

giulia.sa...@gmail.com
Hi all,
I am having problems interpreting the CTP-Tau Joint histograms.
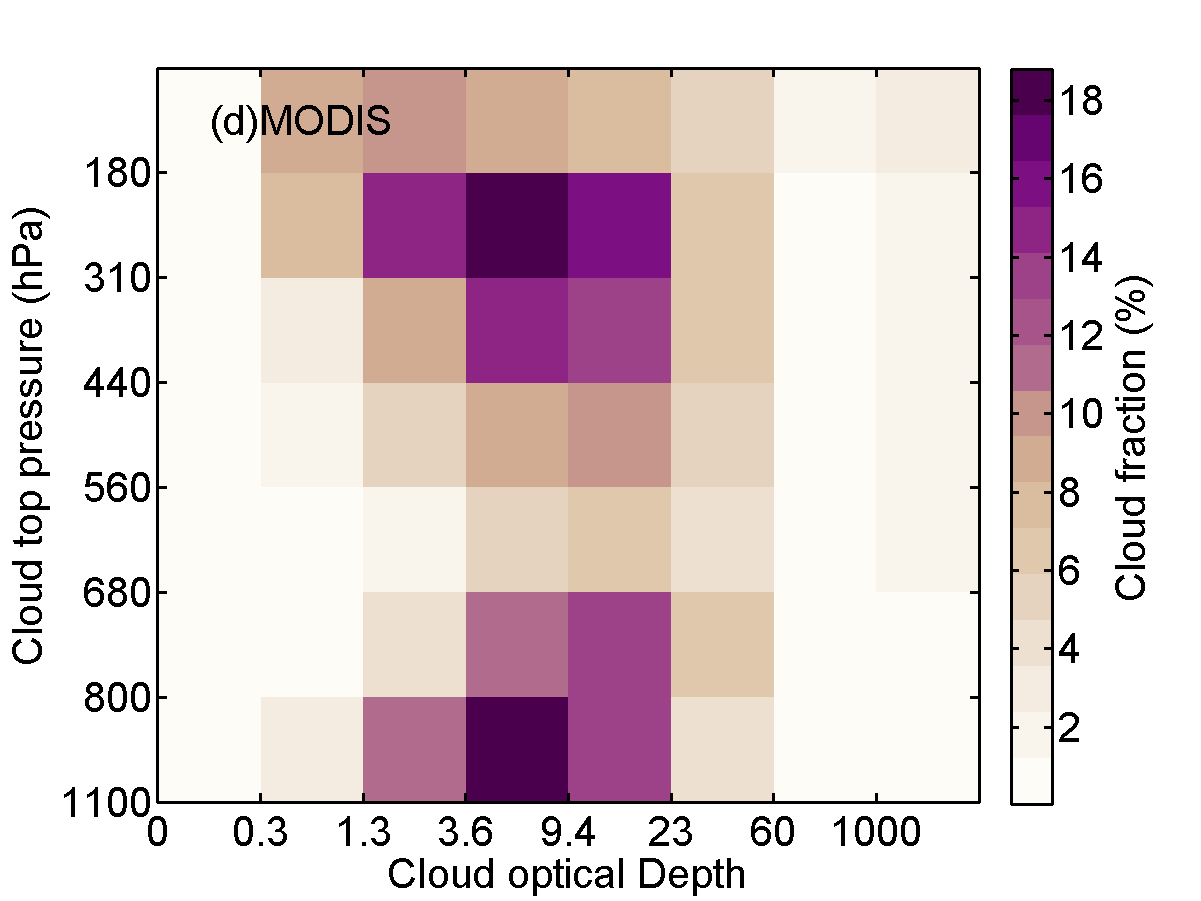
Attached you can find two figures representing, respectively, the joint CTP_tau histogram from ECHAM6-HAM (COSP output file ‘hist_modis.nc’) and MODIS retrieved observations (variable ‘Cloud_Optical_Thickness_ISCCP’) for year 2008. For each
While the values of the fraction of clouds in ECHAM are comparable to the results found in Pincus et al., (2012), Bodas-Salcedo et al., (2011) or showed in COSP quicklooks, the results I obtain from plotting MODIS variable are much higher although the distribution of cloud fraction looks reasonable.
Why do I get such higher values of cloud fraction from MODIS observations? Are they somehow accounting from some clouds that is not included in COSP simulator? Is COSP simulator filtering for a certain cloud phase?
While I found in MODIS ATBD that the CTP-Tau ISCCP histogram are computed for all cloud types, I cannot find in literature such a clarification for COSP.
Perhaps I am not properly processing the data?
If you have been using this variable, how do you process it?
Best,
Giulia

Bodas-Salcedo, Alejandro
Hello Giulia,
I’d recommend doing the following to investigate this:
- Calculate the total cloud fraction by adding all the tau-ctp bins. The value from COSP/clmodis should be close to the model total cloud fraction, calculated over the same area from a standard model diagnostic.
It looks like your observational value will be >100%, implying an error in the plot. I’ve noticed that the observations have 8 bins in the tau axis, when they should only have 7.
- You can also do this using clisccp, instead of clmodis. The histograms shouldn’t be very different. This will give you an internal consistency for the COSP diagnostics.
Regards,
Alejandro
--
You received this message because you are subscribed to the Google Groups "COSP users group" group.
To unsubscribe from this group and stop receiving emails from it, send an email to
cosp-user+...@googlegroups.com.
For more options, visit https://groups.google.com/d/optout.
giulia.sa...@gmail.com
for each lon, lat gridpoint the counts in every COT-CTP bin of the histrogram needs to be divided by the total counts at the lon, lat gridpoint and the multiply this by the mean cloud fraction at the lat, lon grid
Regards,
Giulia
giulia.sa...@gmail.com


Rita Nogherotto
(variable ‘Cloud_Optical_Thickness_ISCCP’) to compare the COSP output, as I can't find it.
Thank you,
Rita