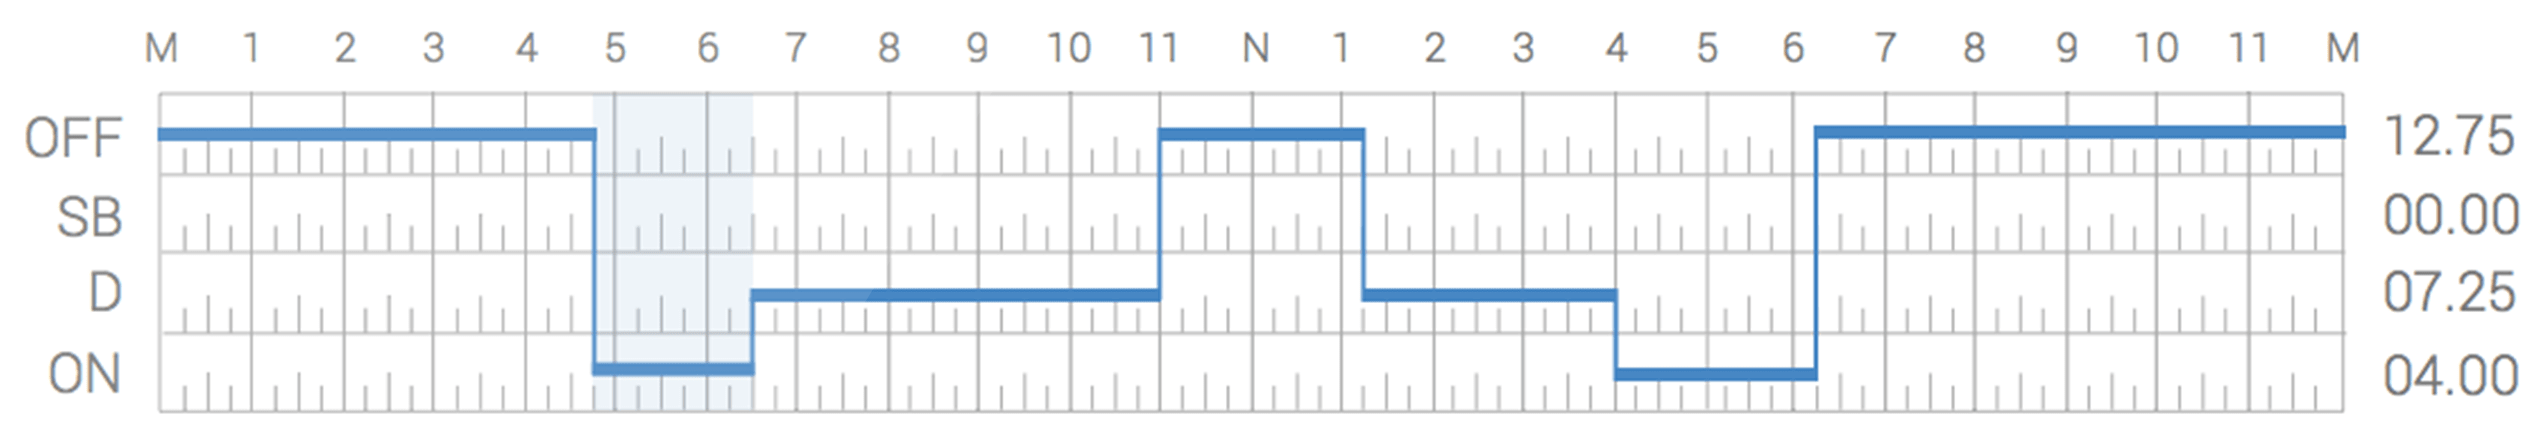
Minor ticks for each grid in graph
21 views
Skip to first unread message

Kedar Desai
Mar 2, 2020, 7:12:19 AM3/2/20
to coreplot-discuss
Hi All,
Thanks & Regards,
Kedar Desai

Eric
Mar 2, 2020, 5:54:09 PM3/2/20
to coreplot-discuss
You can lay more than one axis on top of each other and give each one different labeling parameters (to control the tick spacing) and tick lengths. Hide the axis line (set the line style to nil) for all but one of the axes for better drawing performance and to avoid potential drawing artifacts.
Eric
Kedar Desai
Mar 4, 2020, 4:16:08 AM3/4/20
to coreplot-discuss
Hi Eric,
Thanks for your reply. I have tried and succeeded in creating this graph. I want to achieve another functionality in the same graph, when user taps anywhere in the graph. It should highlight entire plotarea for that data point range, just like higlighted area in first image.
I am using CPTPlotSpaceDelegate's shouldHandlePointingDeviceUpEvent method for detecting touch and retrieving touch point in hostview. But how can I get datapoint range in graph for touched point in hostview? And how can I highlight entire plot area for that particular data points? Can you help me with this?
Kedar Desai
Mar 4, 2020, 7:43:07 AM3/4/20
to coreplot-discuss
Hi,
func plotSpace(_ space: CPTPlotSpace, shouldHandlePointingDeviceDownEvent event: UIEvent, at point: CGPoint) -> Bool {
I worked around the code. And found the closest visible point in plot area. Following is my code:
lastPlotSpaceDownPoint = pointreturn true
}
func plotSpace(_ space: CPTPlotSpace, shouldHandlePointingDeviceUp event: UIEvent, at point: CGPoint) -> Bool {
func plotSpace(_ space: CPTPlotSpace, shouldHandlePointingDeviceUp event: UIEvent, at point: CGPoint) -> Bool {
let distance: CGFloat = CGFloat(hypotf((Float(lastPlotSpaceDownPoint.x - point.x)), (Float(lastPlotSpaceDownPoint.y - point.y))))if abs(distance) < 5 {
let recordIndex = linePlotDS.indexOfVisiblePointClosest(toPlotAreaPoint: point)print(recordIndex)
}return true
}
When user taps near 3rd data point it gives me record index as 3. But how can I find whether it is tapped between 2&3 or 3&4?
On Monday, March 2, 2020 at 5:42:19 PM UTC+5:30, Kedar Desai wrote:
Eric
Mar 4, 2020, 6:55:52 PM3/4/20
to coreplot-discuss
Check the distance between the touch point and both points 2 and 4 to see which one is closer.
Eric
Kedar Desai
Mar 6, 2020, 1:41:57 AM3/6/20
to coreplot-discuss
I am unable to calculate the distance. How to calculate distance between plots? And how can I fill color only between those points in entire area fill?
Kedar Desai
Mar 6, 2020, 7:54:29 AM3/6/20
to coreplot-discuss
Hi.
Thanks for your help. I have worked around the code and got the desired output finally.
On Monday, March 2, 2020 at 5:42:19 PM UTC+5:30, Kedar Desai wrote:
Reply all
Reply to author
Forward
0 new messages