Parameter estimation and rate constant values.
135 views
Skip to first unread message

Kristof Altus
Feb 19, 2022, 7:53:30 PM2/19/22
to COPASI User Forum
Hi,
I'm new to modelling kinetics and overall I think I understand how to input external time course data and set up the parameter estimation (at least I hope so). However, I'm not exactly certain how to interpret the data from the parameter estimation and when I can trust the values it gives. For example I have the following real reaction
2*A -> B + C -> D (A, B and D have all been isolated and the concentrations measured over time, C is a ligand which I can track too but didn't include the Conc data in the model to try to keep it more simple.)
The experimental time course shows there is an induction period mostly likely caused by an initial ligand dissociation from species A and so I have modelled the reaction as follows:
rxn 1, A -> (A-C) + C (ligand dissociation)
rxn 2, (A-C) + A -> B (dimerisation)
rxn 3, B + C -> D (product formation)
rxn 4, B -> E (very small side reaction)
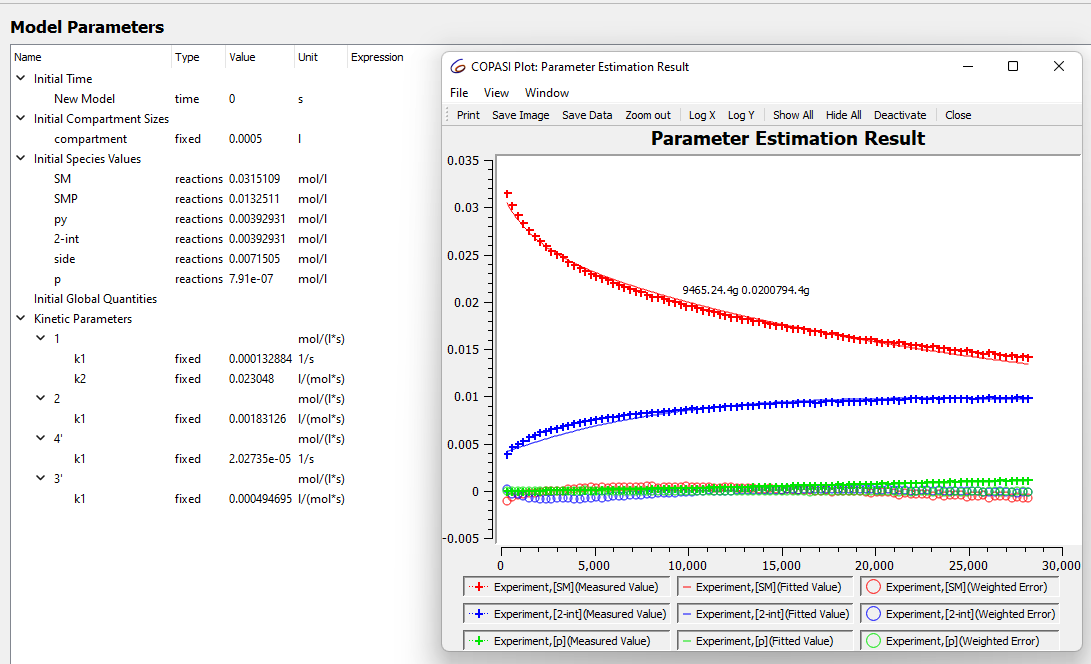
when I model the data like this for my reaction at 30 C I get what looks like a good fit.
these values seem to be stable no matter how many times I run the parameter estimation
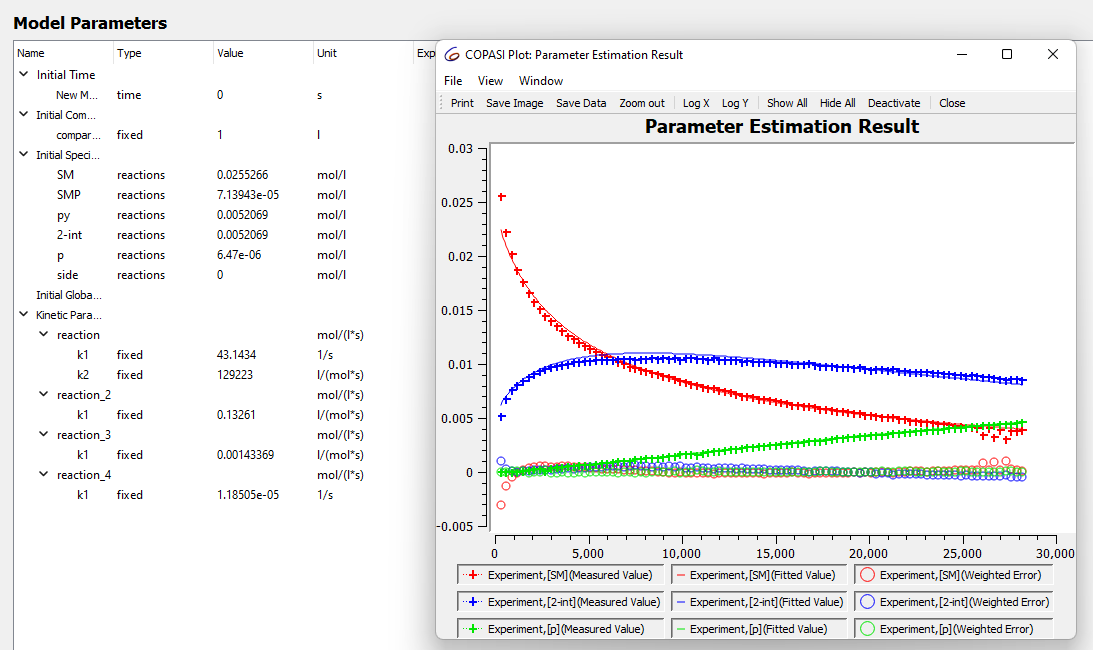
However when I run the estimation for the data set I collected at 40 C the numbers look weird event though the fit looks good.
these numbers are also not stable and when I run the parameter estimation again they change. sometimes to really small numbers and sometimes to massive numbers, does this mean something is wrong in the model?
My main goal is to be able to plot an eyring plot of the rate constants from the time course over a temp range 30-60 C (10 C intervals). However, I'm not sure when I can trust the K values as they seem to change frequently.
Also I have triplicate data for all the temperatures, am I better off modelling the data together or individually and then averaging to obtain accurate rate constants? Any help would great as I'm a bit lost.
cheers,
Kris

Mendes,Pedro
Feb 22, 2022, 9:03:53 AM2/22/22
to copasi-u...@googlegroups.com
Hi Kris,
Both fits don't look bad, however if you pay attention to the early part
of the curves, there seems to be a larger error. This is likely because
you are also fitting the initial conditions and you are giving them too
large an interval. This may also be the reason why you have different
results in different runs of the parameter estimation.
You didn't tell us how you set up the fitting, I am assuming that you
are using some stochastic algorithm, or at least using random initial
values for the parameters. When you get widely different values for the
parameters but similar good fits, this is a sign of lack of parameter
identifiability. The way to overcome this is to supply more data (i.e.
experiments with different experimental conditions), or reduce the
number of unknown parameters (but this is hard if you have no idea of
what are the values of the parameters).
As for the triplicates, it is best to fit all three experiments because
that constraints the parameters more. Also, the approach you mentioned
of averaging the parameter estimates after independent fits carries more
strict assumptions (gaussian distribution of error on the parameter
estimates, rather than on the observed data).
I think if you want further help I would need to see your model and data
files. You can email them directly if you want.
Also, we will be holding a 3-day virtual workshop on computational cell
biology which will cover these aspects, see announcement on our Center's
web page https://health.uconn.edu/cell-analysis-modeling/ ). This could
be useful as we will give direct assistance with each participant's
project. However it is only in May...
Pedro
On 2/19/22 19:53, Kristof Altus wrote:
> Hi,
>
> I'm new to modelling kinetics and overall I think I understand how to
> input external time course data and set up the parameter estimation (at
> least I hope so). However, I'm not exactly certain how to interpret the
> data from the parameter estimation and when I can trust the values it
> gives. For example I have the following real reaction
>
> 2*A -> B + C -> D (A, B and D have all been isolated and the
> concentrations measured over time, C is a ligand which I can track too
> but didn't include the Conc data in the model to try to keep it more
> simple.)
>
> The experimental time course shows there is an induction period mostly
> likely caused by an initial ligand dissociation from species A and so I
> have modelled the reaction as follows:
>
> rxn 1, A -> (A-C) + C (ligand dissociation)
> rxn 2, (A-C) + A -> B (dimerisation)
> rxn 3, B + C -> D (product formation)
> rxn 4, B -> E (very small side reaction)
>
> when I model the data like this for my reaction at 30 C I get what looks
> like a good fit.
>
> You received this message because you are subscribed to the Google
> Groups "COPASI User Forum" group.
> To unsubscribe from this group and stop receiving emails from it, send
> an email to copasi-user-fo...@googlegroups.com
> <mailto:copasi-user-fo...@googlegroups.com>.
> To view this discussion on the web visit
> https://groups.google.com/d/msgid/copasi-user-forum/53e05b56-4689-4719-aa02-e322f0914d1an%40googlegroups.com
> <https://groups.google.com/d/msgid/copasi-user-forum/53e05b56-4689-4719-aa02-e322f0914d1an%40googlegroups.com?utm_medium=email&utm_source=footer>.
--
Pedro Mendes, PhD
Professor and Director
Richard D. Berlin Center for Cell Analysis and Modeling
University of Connecticut School of Medicine
group website: http://www.comp-sys-bio.org
Both fits don't look bad, however if you pay attention to the early part
of the curves, there seems to be a larger error. This is likely because
you are also fitting the initial conditions and you are giving them too
large an interval. This may also be the reason why you have different
results in different runs of the parameter estimation.
You didn't tell us how you set up the fitting, I am assuming that you
are using some stochastic algorithm, or at least using random initial
values for the parameters. When you get widely different values for the
parameters but similar good fits, this is a sign of lack of parameter
identifiability. The way to overcome this is to supply more data (i.e.
experiments with different experimental conditions), or reduce the
number of unknown parameters (but this is hard if you have no idea of
what are the values of the parameters).
As for the triplicates, it is best to fit all three experiments because
that constraints the parameters more. Also, the approach you mentioned
of averaging the parameter estimates after independent fits carries more
strict assumptions (gaussian distribution of error on the parameter
estimates, rather than on the observed data).
I think if you want further help I would need to see your model and data
files. You can email them directly if you want.
Also, we will be holding a 3-day virtual workshop on computational cell
biology which will cover these aspects, see announcement on our Center's
web page https://health.uconn.edu/cell-analysis-modeling/ ). This could
be useful as we will give direct assistance with each participant's
project. However it is only in May...
Pedro
On 2/19/22 19:53, Kristof Altus wrote:
> Hi,
>
> I'm new to modelling kinetics and overall I think I understand how to
> input external time course data and set up the parameter estimation (at
> least I hope so). However, I'm not exactly certain how to interpret the
> data from the parameter estimation and when I can trust the values it
> gives. For example I have the following real reaction
>
> 2*A -> B + C -> D (A, B and D have all been isolated and the
> concentrations measured over time, C is a ligand which I can track too
> but didn't include the Conc data in the model to try to keep it more
> simple.)
>
> The experimental time course shows there is an induction period mostly
> likely caused by an initial ligand dissociation from species A and so I
> have modelled the reaction as follows:
>
> rxn 1, A -> (A-C) + C (ligand dissociation)
> rxn 2, (A-C) + A -> B (dimerisation)
> rxn 3, B + C -> D (product formation)
> rxn 4, B -> E (very small side reaction)
>
> when I model the data like this for my reaction at 30 C I get what looks
> like a good fit.
>
> Screenshot_9.png
>
> these values seem to be stable no matter how many times I run the
> parameter estimation
>
> However when I run the estimation for the data set I collected at 40 C
> the numbers look weird event though the fit looks good.
>
> these values seem to be stable no matter how many times I run the
> parameter estimation
>
> However when I run the estimation for the data set I collected at 40 C
> the numbers look weird event though the fit looks good.
> Screenshot_10.png
> these numbers are also not stable and when I run the parameter
> estimation again they change. sometimes to really small numbers and
> sometimes to massive numbers, does this mean something is wrong in the
> model?
>
> My main goal is to be able to plot an eyring plot of the rate constants
> from the time course over a temp range 30-60 C (10 C intervals).
> However, I'm not sure when I can trust the K values as they seem to
> change frequently.
>
> Also I have triplicate data for all the temperatures, am I better off
> modelling the data together or individually and then averaging to obtain
> accurate rate constants? Any help would great as I'm a bit lost.
>
> cheers,
>
> Kris
>
>
>
>
> --
> these numbers are also not stable and when I run the parameter
> estimation again they change. sometimes to really small numbers and
> sometimes to massive numbers, does this mean something is wrong in the
> model?
>
> My main goal is to be able to plot an eyring plot of the rate constants
> from the time course over a temp range 30-60 C (10 C intervals).
> However, I'm not sure when I can trust the K values as they seem to
> change frequently.
>
> Also I have triplicate data for all the temperatures, am I better off
> modelling the data together or individually and then averaging to obtain
> accurate rate constants? Any help would great as I'm a bit lost.
>
> cheers,
>
> Kris
>
>
>
>
> You received this message because you are subscribed to the Google
> Groups "COPASI User Forum" group.
> To unsubscribe from this group and stop receiving emails from it, send
> an email to copasi-user-fo...@googlegroups.com
> <mailto:copasi-user-fo...@googlegroups.com>.
> To view this discussion on the web visit
> https://groups.google.com/d/msgid/copasi-user-forum/53e05b56-4689-4719-aa02-e322f0914d1an%40googlegroups.com
> <https://groups.google.com/d/msgid/copasi-user-forum/53e05b56-4689-4719-aa02-e322f0914d1an%40googlegroups.com?utm_medium=email&utm_source=footer>.
--
Pedro Mendes, PhD
Professor and Director
Richard D. Berlin Center for Cell Analysis and Modeling
University of Connecticut School of Medicine
group website: http://www.comp-sys-bio.org
Kristof Altus
Feb 22, 2022, 10:21:25 AM2/22/22
to COPASI User Forum
Hi Pedro,
Yes I would love some more help so I'll email you directly. I did see the workshop and will register for it.
cheers.

Carlos Vera
Apr 1, 2022, 6:40:53 PM4/1/22
to COPASI User Forum
Hi everyone,
.Regarding on this subject, I have a question. Maybe someone could help me, please.
I have an enzyme that catalyze parallel reactions. Under the following pattern A=B; B=C; C=A. I have been able to construct the corresponding rate equations (VA; VB and VC) as funtion of VmA, VmB, VmCy, KmA, KmB and KmC. Rate equations ( VA, VB and VC) share some parameters, let say KmA appers in all the rate equations. My question is:
How can made explicit in copasi that KmA is the same parameter in the three rates equations?
This having in mind that I need to do a parameters estimation next.
All the best
carlos

Hoops, Stefan (sh9cq)
Apr 1, 2022, 6:49:00 PM4/1/22
to copasi-u...@googlegroups.com
Hello Carlos,
You can create a global quantity of type fixed name KmA and use that
map the parameter KmA in the kinetic law to it in the reaction widget.
You will have to do the mapping for all the reactions in which KmA
appears.
I hope that helps,
Stefan
--
Stefan Hoops, Ph.D.
Research Associate Professor
Biocomplexity Institute & Initiative
University of Virginia
995 Research Park Boulevard
Charlottesville, VA 22911
Phone: +1 540 570 1301
Email: sho...@virginia.edu
You can create a global quantity of type fixed name KmA and use that
map the parameter KmA in the kinetic law to it in the reaction widget.
You will have to do the mapping for all the reactions in which KmA
appears.
I hope that helps,
Stefan
Stefan Hoops, Ph.D.
Research Associate Professor
Biocomplexity Institute & Initiative
University of Virginia
995 Research Park Boulevard
Charlottesville, VA 22911
Phone: +1 540 570 1301
Email: sho...@virginia.edu
Carlos Vera
Apr 1, 2022, 7:34:04 PM4/1/22
to COPASI User Forum
Dear Stefan, I will do as you suggest. I' ll tell if it work
Thank you,
carlos
Reply all
Reply to author
Forward
0 new messages