Plot with sum of few specific species
18 views
Skip to first unread message

Roma Smirnov
May 8, 2022, 5:29:17 AM5/8/22
to COPASI User Forum
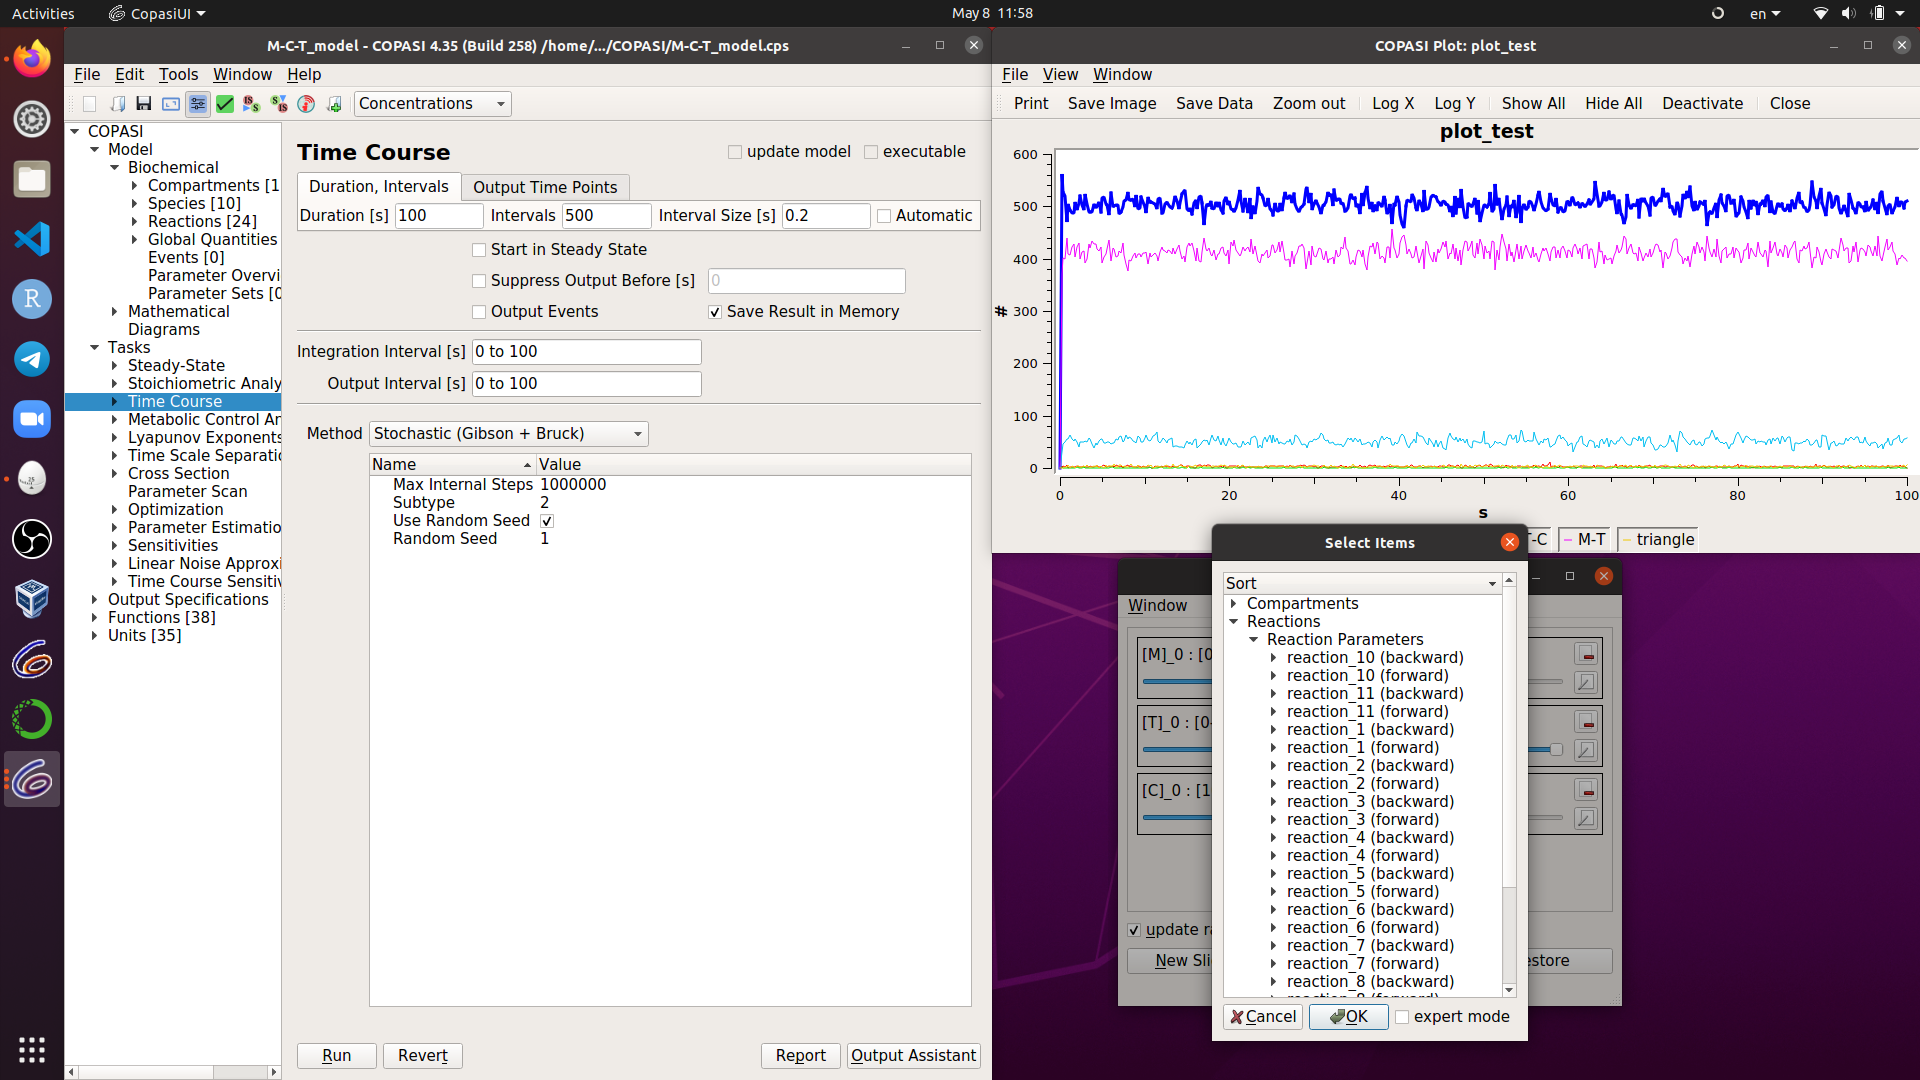
I'm using a Stochastic (Gibson + Bruck) method to implement some model (fig.1). And in my project I have to make two plots: component-by-component plot as well as graph with the sum of few specific species.
I'm just wondering is there any option to plot the second graph immediately in COPASI without usage excel/google sheets?
Cheers,
Roma
I'm just wondering is there any option to plot the second graph immediately in COPASI without usage excel/google sheets?
Cheers,
Roma

Frank Bergmann
May 9, 2022, 2:50:29 AM5/9/22
to COPASI User Forum
Hello Roma,
the way to do that in COPASI would be to create a global quantity (a global parameter) of type assignment [1], in that assignment you would create the sum of the component concentrations / particle numbers as desired.
Please let us know if you need help with doing this,
best
Frank
Roma Smirnov
May 13, 2022, 5:10:25 AM5/13/22
to COPASI User Forum
I implemented it! Thank you for clear and detailed instruction!
Roma
Roma
Reply all
Reply to author
Forward
0 new messages