|
by Leah Wang
The best and latest criminal legal system data are often scattered across different government agencies, in incompatible formats, and difficult to compare. To make the most useful information more accessible, we make the underlying data for our timely reports and briefings available in our Data Toolbox, and create state-specific graphics on our comprehensive State Profiles pages. Today, we’ve added a rich new series of resources for our users of our work:
First, we now have a downloadable spreadsheet of the most recently available incarceration data for people in state prisons and in local jails, by race and ethnicity and by sex, for all 50 states and D.C. Unlike other datasets, ours provides apples-to-apples state comparisons in three formats (counts, rates, and percentages): We’ve done the math to standardize incompatible measurements found in the various original data sources.
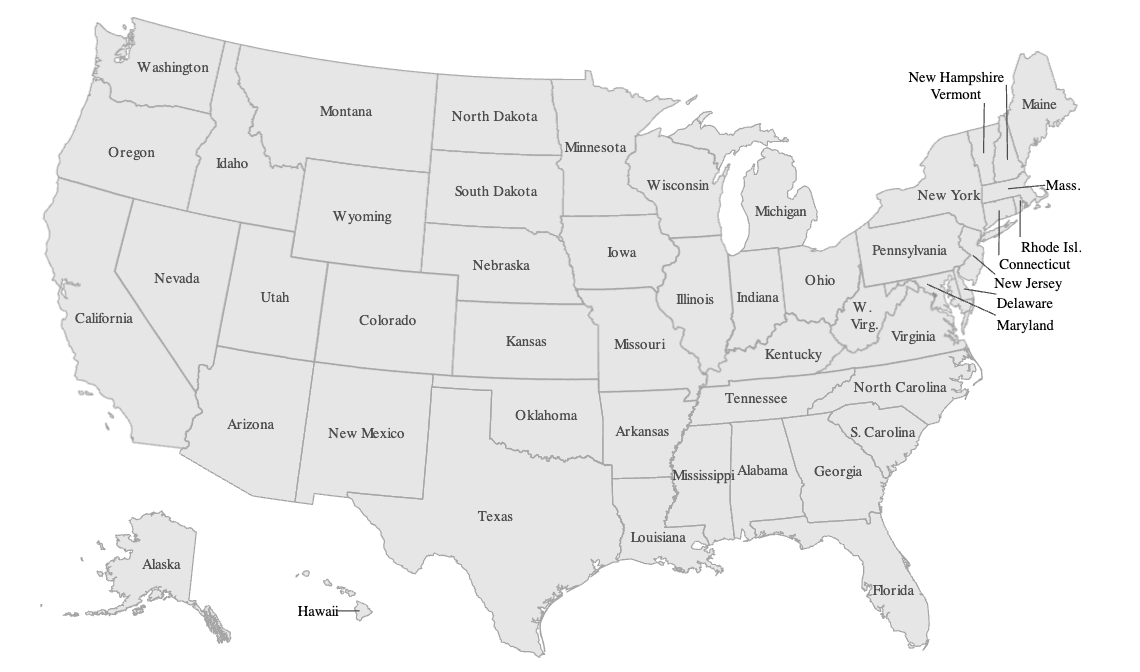
Second, we’ve updated over 100 of the key graphics on our State Profiles pages showing prison and jail incarceration rates by race and ethnicity, and how the racial composition of each state’s prisons and jails compare to the total state population. Click the map below to find your state's profile page and updated graphics:

Click that map above to find your state profile page and our updated graphics showing racial disparities in incarceration rates.
Using the new data tables to compare states
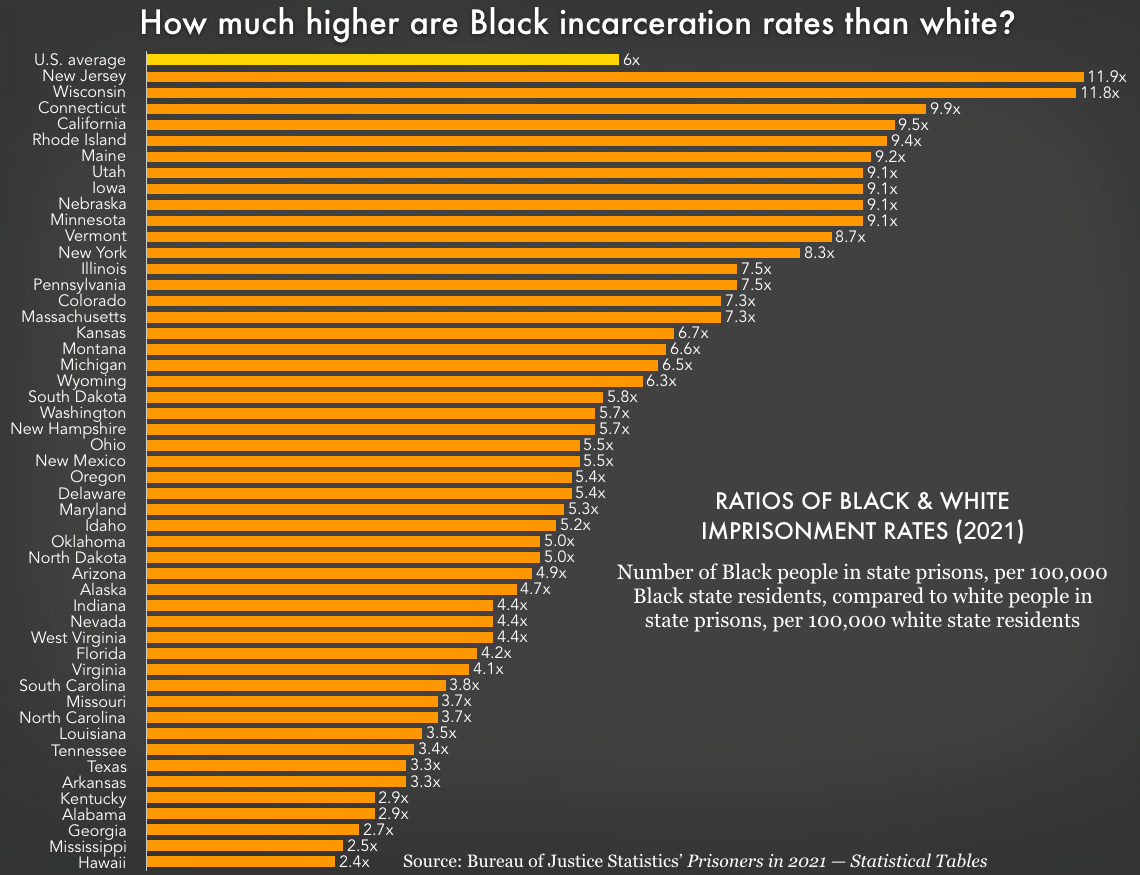
The data tables in the Data Toolbox make state and group comparisons much easier. For instance, they offer a closer look at the racial disparities in each state’s use of incarceration — that is, states lock up a larger proportion of people of color than you would expect based on how many actually live there. (This comes as no surprise given the racial bias found in each stage of the system, from policing to pretrial detention, sentencing, and even diversion opportunities.) We used the data to compare Black and white imprisonment rates by state, finding that every state locks up Black people at a rate at least double that of white people — and, on average, at six times the rate of white residents:

Every state incarcerates Black residents in its state prisons at a higher rate than white residents. For comparisons to other race/ethnicity categories, see individual state profile pages.
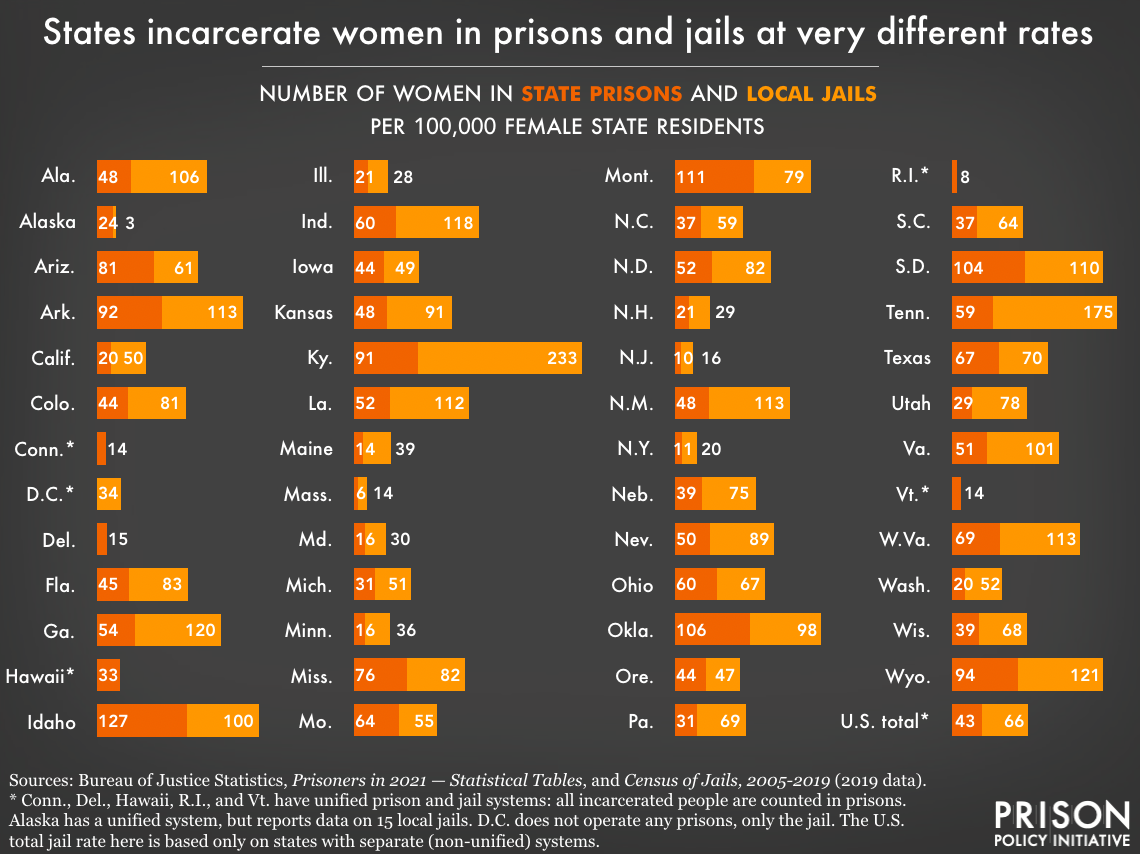
Readers can also use this new and comprehensive dataset to see, for example, how states handle women’s incarceration very differently:

Jails play an outsize role in the mass incarceration of women, which has serious consequences for their health and their families. States that have a single, “unified” prison and jail system report all incarceration data as prison data, so no separate jail incarceration rate is available for them (this includes Conn., Del., Hawaii, R.I., and Vt.). Washington, D.C., meanwhile, only reports jail data; its prison population is included in the federal system.
Important data notes
For users of our work who follow our data sourcing and methodologies closely, we offer some important context for understanding and using Bureau of Justice Statistics data over other options (and hopefully, head off a few questions you may have in your search for incarceration stats):
- We used Bureau of Justice Statistics (BJS) data rather than individual states’ departments of correction (DOC) published information, even though state DOCs sometimes have more frequently updated or more detailed data regarding prison populations. Not all states are forthcoming with their data (nor do they always provide it in a useful format), so we prefer the uniform time frame and population definitions guaranteed by BJS data. However, for more granular or frequently updated information, you may want to consult your state DOC’s data.
- It’s important to know that state prison and local jail data are published by the Bureau of Justice Statistics (BJS) on different timelines, and represent slightly different populations. Although publication schedules can and do change, we can generally expect BJS to publish state and federal prison data annually, which can be broken down by state. Jail data by state, on the other hand, is collected and published less frequently, with the most recent dating back to 2019, and before that, 2013. We likely won’t see another comprehensive, state-level jail dataset until after 2024. We’re hopeful that BJS will continue to release detailed, state-level data on an annual basis as often as possible, as this is far more helpful than data we can only update every decade.
Find our new resources in the Data Toolbox and on the state profiles pages.
Our work is made possible by private donations. Can you help us keep going? We can accept tax-deductible gifts online or via paper checks sent to PO Box 127 Northampton MA 01061. Thank you!
|


