A measure of the increase in eBirding in Colorado
189 views
Skip to first unread message

David Suddjian
Nov 18, 2022, 1:36:17 PM11/18/22
to Colorado Birds, David Suddjian
CoBirders,
David Suddjian
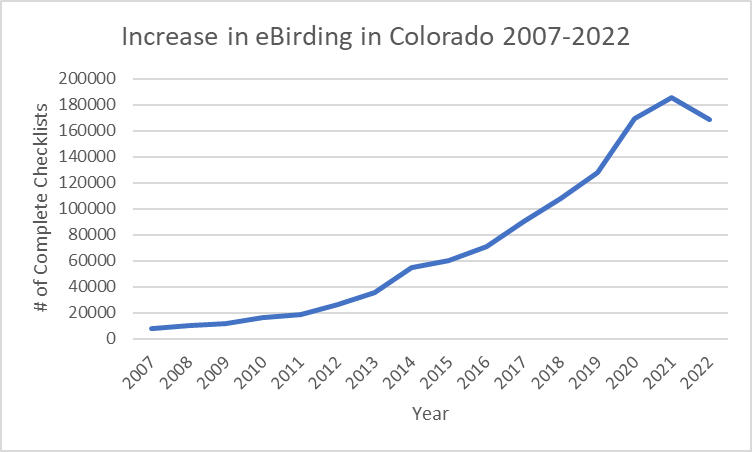
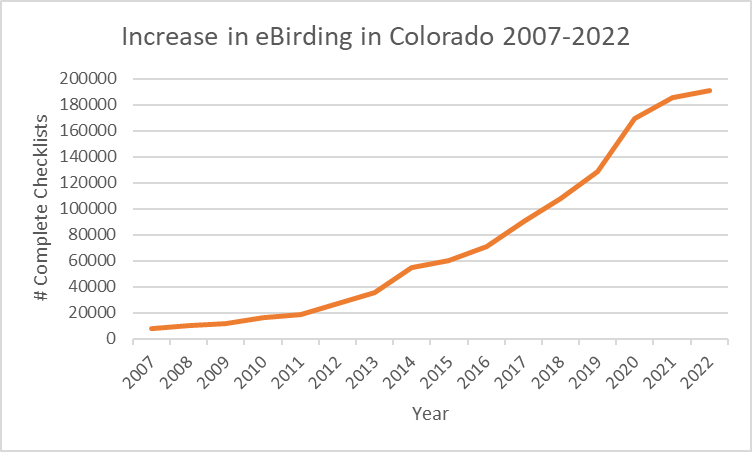
It is obvious that there has been a dramatic increase in the number of birders in Colorado over the last 15 years (and longer), and with that came a great increase in the use of eBird. Curious about this, I obtained the number of complete eBird checklists per year in Colorado for the period 2007 - 2022 (year to date through the 2nd week of November). That data is shown below in Figure 1, showing the steady increase over this period. The apparent drop in 2022 is only because the chart is still missing 6 weeks of data from the end of this year. Using the average number of complete lists per week, the 2022 total can be projected to the end of this year, and it then shows continued growth through this year (Figure 2). In the end, the 2022 total will likely be more than shown because December has some active eBirding weeks that may be above the weekly average (due to CBCs, I think).
Figures 1 and 2 show steady and even increasing growth over this period, really kicking in over the last 10 years, with the (projected) rate slowing in 2022. There are two increases in the rate of growth over the general trend that I see on the lines: one in 2014 and the other - a steeper rise - in 2020. The later must be the Covid impact, when more people were birding and with more opportunity to submit checklists. I believe I know what the 2014 rate increase represents, but I won't post here on that now. I'll wager few can guess the likely cause of that extra upward angle in 2014.
Figure 1. Number of complete checklists in Colorado year to date (current through the 2nd week of November)
Figure 2. Number of complete checklists in Colorado with projection through the end of 2022
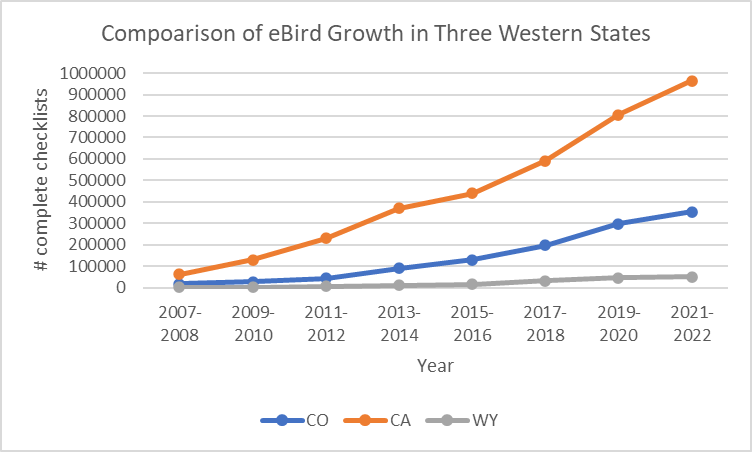
Then I was curious about how Colorado's eBird growth compared to other western states. I selected California, my home state, with a much larger population than Colorado and presumably lots more eBirders. And I chose Wyoming, as a neighboring state, with a much smaller population of people and eBirders. The results are shown on Figure 3 (using 2-year intervals for this chart). All three states have the same general growth, but the scale of the graph with CA included makes it hard to appreciate the change in WY, with an order of magnitude difference in the number of checklists per year between those states. Both showed an increase in the 2020 Covid period, although with the 2-year interval this is less apparent on the graph than in Figures 1 and 2.
Figure 3. Comparison of eBird growth in Colorado, California and Wyoming
Table 1. Number of complete checklists in the three states for 2-year intervals, 2007-2022 (year to date).
| CO | CA | WY | |
| 2007-2008 | 18160 | 62167 | 2350 |
| 2009-2010 | 27764 | 130327 | 3692 |
| 2011-2012 | 45435 | 230234 | 7104 |
| 2013-2014 | 90591 | 371325 | 12986 |
| 2015-2016 | 131061 | 439959 | 16292 |
| 2017-2018 | 197940 | 592518 | 33281 |
| 2019-2020 | 297300 | 806772 | 46265 |
| 2021-2022 | 354267 | 964379 | 51242 |
David Suddjian
Ken Caryl Valley
Littleton, CO

Gregg Goodrich
Nov 20, 2022, 1:17:29 PM11/20/22
to Colorado Birds
David
Stunning graphs documenting the amazing increase in number of checklists on eBird. Thanks for doing this interesting analysis.
I will take a guess at the bigger increase in checklists in 2014. Cornell released the eBird mobile app in June of 2014. Before that time their were some birders that used BirdLog to log birds on their smart phones. Cornell took over BirdLog and converted it to eBird mobile and that really ushered in the use of smart phones to enter bird lists in the field as they birded. Here is a link to the first announcement of eBird mobile.
Gregg Goodrich
Highlands Ranch
Reply all
Reply to author
Forward
0 new messages