Adding histogram/Frequency bar plot track in circos plot.
168 views
Skip to first unread message

Arushi Mahajan
Aug 18, 2021, 11:50:20 PM8/18/21
to Circos
Hi,
I am a beginner at circos plot and have been stuck at a problem from the past week.
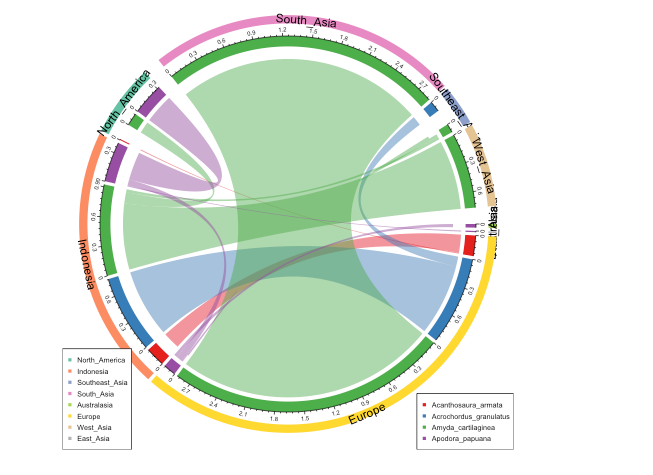
I am doing all the coding in r. I have a df similar to this link https://stackoverflow.com/questions/39188761/circlize-chord-diagram-with-multiple-levels-of-data/39192919#39192919
I have used the same code for group by regions with some minor changes.
Now, I would like to insert a new track of Histogram/Frequency bar plot after the first track that is South Asia, North America etc.
So after the first track, I want to plot the flow values for each regions as histograms or frequency bar plot.
Any help would be appreciated.
Thanks.
Reply all
Reply to author
Forward
0 new messages