2D Data Track Tiles only shown in chr1 instead of all chromosomes
31 views
Skip to first unread message

Carina Lehmann
Mar 21, 2023, 3:22:38 PM3/21/23
to Circos
Hello, I'm trying to create a circos plot using this Hippopotamus amphibius
Karyofile:
chr - ha1 1 0 230615339 chr1
chr - ha2 2 0 215351208 chr2
chr - ha3 3 0 190109974 chr3
chr - ha4 4 0 183506384 chr4
chr - ha5 5 0 168265085 chr5
chr - ha6 6 0 162819330 chr6
chr - ha7 7 0 141669128 chr7
chr - ha8 8 0 141068932 chr8
chr - ha9 9 0 139430547 chr9
chr - ha10 10 0 113992390 chr10
chr - ha11 11 0 105293857 chr11
chr - ha12 12 0 101820481 chr12
chr - ha13 13 0 94099218 chr13
chr - ha14 14 0 79265376 chr14
chr - ha15 15 0 61932967 chr15
chr - ha16 16 0 59377819 chr16
chr - ha17 17 0 57871909 chr17
chr - haX X 0 133980000 chrX
and I want to show repeats in the genome (which I got through the RepeatMasker tool) using tiles. The dataset I'm using for the 2D Data Track looks like this (this is only a little section to show as an example), with the chromosome, start and end:
ha1 230402756 230402820
ha1 230462194 230462265
ha1 230612989 230613448
ha2 230618533 230618592
ha2 230697788 230698014
ha2 230765056 230765453
... ... etc.
and it continues with all the chromosomes, from ha1 to haX, just as shown in the karyofile (due to limitations, I'm using 25000 random lines from the complete repeat list). I'm pretty sure this is the right format and also the right naming (ha1 in karyofile and ha1 in the repeat list, etc.), as tiles don't require a 4th column with values or anything.
But when I'm trying to plot this, the repeat-tiles only show up for chromosome 1 instead of all the chromosomes. I did not limit anything to only show ha1 in "ideogram". I'm attaching some images for reference and hope that anyone finds my mistake:
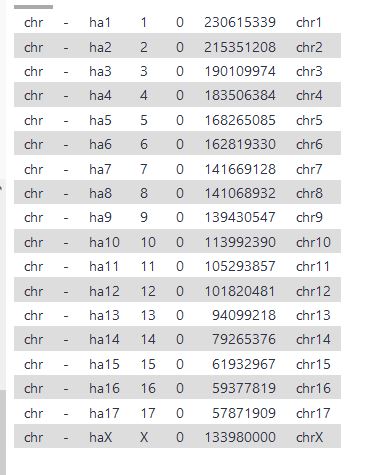
Hippo karyofile
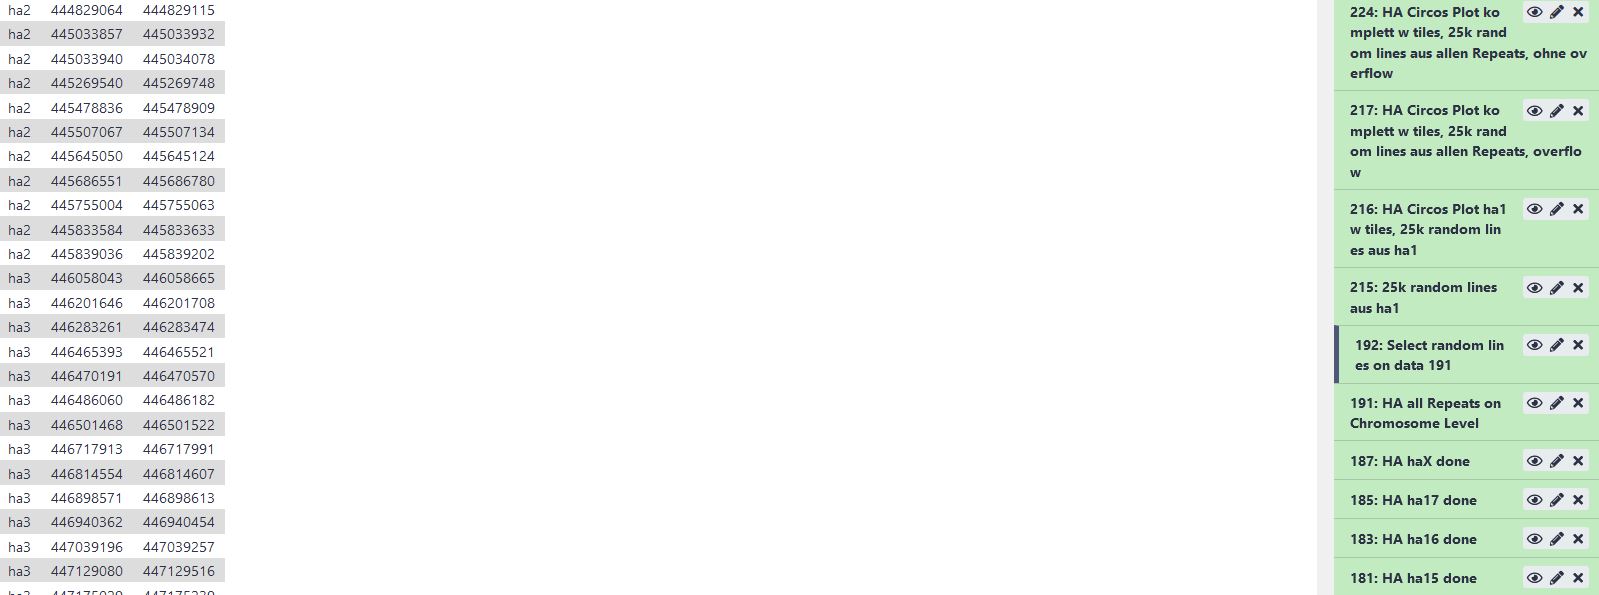
selected random linkes from the complete repeats-list
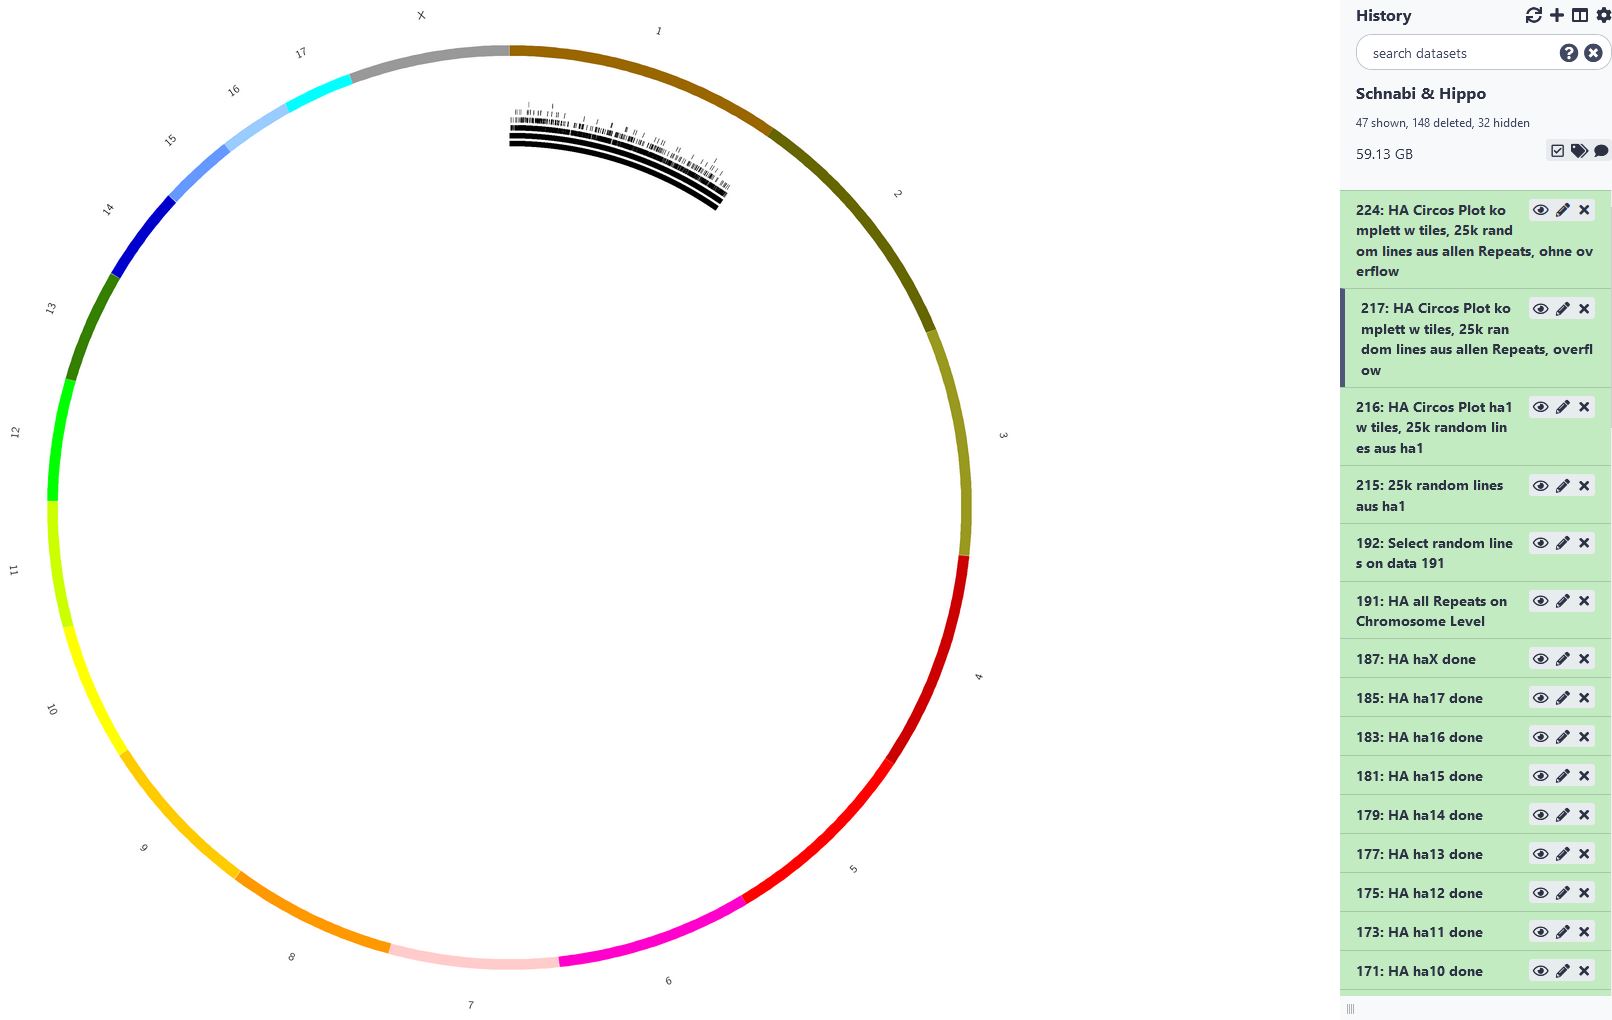
in the ideogram, only chromosome 1 (ha1) shows the tiles, although the list used for the 2D Data Tracks with random lines contains all the chromosomes from ha1 to haX.
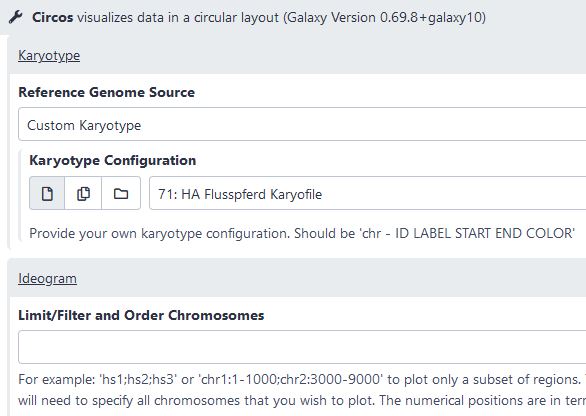
in "ideogram", I did not limit anything.
Thanks in advance!
Carina Lehmann
Carina Lehmann
Reply all
Reply to author
Forward
0 new messages