Circos plot with logfold change data

Aranyak Goswami
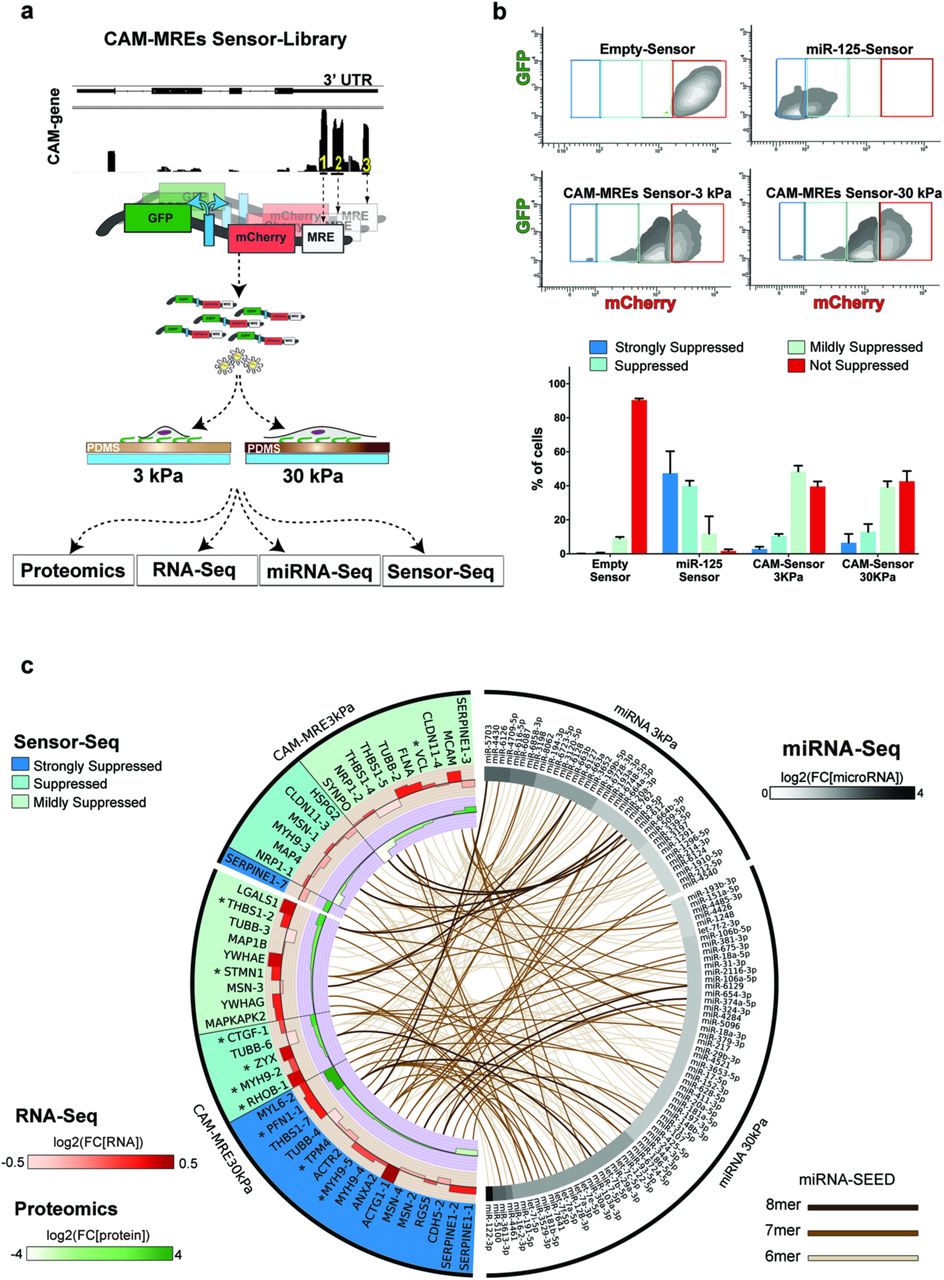
I am new to Circos plots and have installed the program in my Linux cluster. I want to build a plot whose details are given below.
Outer circle -I have 8 mRNA libraries differential expression genes (upregulated and downregulated genes) sorted based on p-adj values > 0.05. I want to represent these data on the outer track of the circle.
Inner circle
The inner-circle have will have mRNA targets for each
of the 8 libraries for both up-regulated and down-regulated genes sorted on
p-adj values > 0.05 The first few lines of the data look like this. I have
data for each upregulated and downregulated genes.
PS- I have already practiced with all tutorials given on the circos website and used the circos online tutorial .
I just wanted to know how to change y data and adapt the scripts to do my work. The type of plot I need is something like this.