nested circos
81 views
Skip to first unread message

Grant Hovhannisyan
Aug 1, 2021, 7:20:50 PM8/1/21
to Circos
Dear all,
Sorry to bother with at the first glance a basic question.
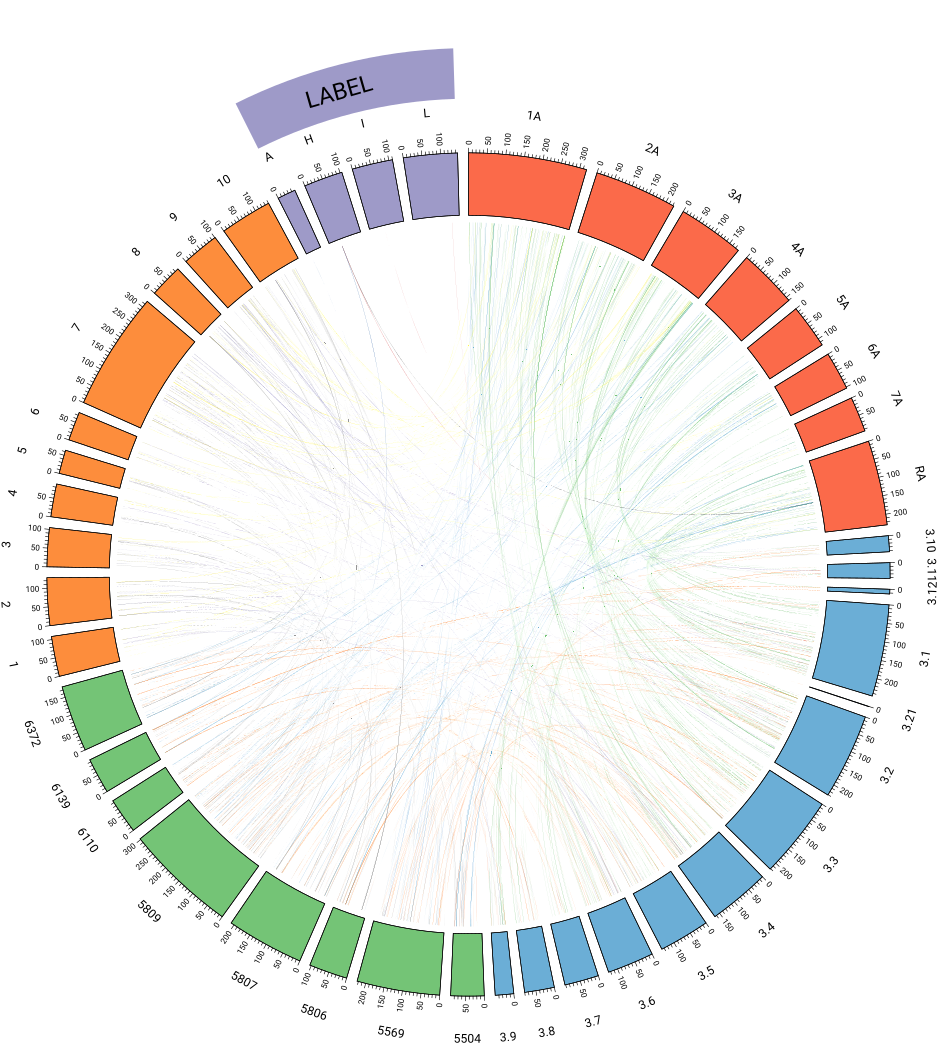
I am plotting pairwise synteny data between 5 species, and I managed to make a circos plot so that chromosomes of each species have different colors. What I additionally want to do is to draw above the chromosomes of each species an additional circos layer showing the name of the species (or whatever label). Please see attached an example where I manually added an additional layer on top of only 1 species.
I'd appreciate if you can hint how is it possible to do for all species.
Thanks

mostafa eltejaee
Aug 3, 2021, 12:38:27 AM8/3/21
to Circos
Hi, you can do it by using highlights, wedge highlight specifically. Use this setting:
r0 = 1.1r
r1 = 1.4r
Grant Hovhannisyan
Aug 3, 2021, 4:53:17 AM8/3/21
to Circos
Hi, thanks for suggestion
but how can I avoid having gaps between chromosomes? The maximum size of the highlight can be the size of the chromosome right?
but how can I avoid having gaps between chromosomes? The maximum size of the highlight can be the size of the chromosome right?

Jonathan Schmitt
Apr 6, 2022, 12:18:15 PM4/6/22
to Circos
I am also curious how this can be achieved in circos. I've done some searching but I haven't yet found an answer. Any help would be appreciated!
thanks
Reply all
Reply to author
Forward
0 new messages