Scala memory performance for chisel simulation
1,569 views
Skip to first unread message

Martoni
Aug 26, 2021, 8:41:59 AM8/26/21
to chisel-users
Hi all,
I'm writting a CIC filter in Chisel3. The project is open source and available on github :
To test it I recorded some sound with a PDM microphone in csv format (with digital probe on quickfeather development board) available in assets directory of project.
My goal is to use this real life PDM signal to feed the CIC and get back pcm signal to hear it with audacity software (because audacity have a cool raw import option :).
At first I tryied to use chiselTester to read PDM file and simulate CIC then record PCM in binary file format. The simulation works on little samples, but if I try longer sample I rapidly get memory problems :
[warn] In the last 10 seconds, 5.152 (51,7%) were spent in GC. [Heap: 0,01GB free of 1,00GB, max 1,00GB] Consider increasing the JVM heap using `-Xmx` or try a different collector, e.g. `-XX:+UseG1GC`, for better performance.
I increased memory available with following SBT command argument :
$ sbt -mem 8192
And I can simulate longer sample. But the problem came back quickly and I have to add more and more memory.
Is it normal that I need so much memory for simulation ? Or am I writing scala in the wrong way ?
To compare simulation method I also wrote a C++ Verilator class simulation : https://github.com/Martoni/CIC/tree/main/verilator/cic
This C++ simulation works without memory problem.
I'm relatively new to Scala (I'm only at the middle of the Odersky book :) and I probably make some scala mistakes to eat so much memory no ?
Thank you for reading this far
Fabien Marteau
Front de Libération des FPGA

Kevin Laeufer
Aug 26, 2021, 11:45:25 AM8/26/21
to chisel...@googlegroups.com
Hi Fabien,
Thanks for trying out chiseltest. I am not sure what the cause of the
excess memory usage is, but I have a couple of questions:
When you observed the excess memory usage:
1) Were you using the Verilator backend or the default backend (which
will always be treadle)?
2) Did you have waveform dumping enabled?
With the default backend (treadle) and VCD writing on, one can very
quickly run into memory problems since treadle keeps the whole VCD in
memory and only writes to disk at the end of the simulation.
Looking at your testbench, the way that you load the pdm values might
use a lot of memory.
```.scala
val bis = new BufferedInputStream(new FileInputStream(pdmpath))
val pdm = Stream.continually(bis.read).takeWhile(-1 !=
_).map(_.toByte).toArray
bis.close
```
This code will load all pdm values into memory and they will stay there
until the end of your test. An alternative would be to keep the `bis`
opening at the beginning of the test, move the reading from the stream
into your testing loop and then only close the file after your test is
done. This way the whole file should never be in memory, only the chunks
that you are currently reading.
There could also be other causes but it will probably come down to
either chiseltest or the way you handle files. One way to debug this
would be do decouple both. You could remove the actual chiseltest code
and only load in the pdm file and save to an output file (with some
random data). On the other hand you could remove the pdm file loading
(substitute with random or constant data) and the file saving.
If either of these things leads to normal memory consumption, you know
that the other one is to blame.
I hope this helps and feel free to follow up with any further questions
you might have.
Good luck!
Kevin
On 8/26/21 5:41 AM, Martoni wrote:
> Hi all,
>
> I'm writting a CIC filter in Chisel3. The project is open source and
> available on github :
> https://github.com/Martoni/CIC
>
> To test it I recorded some sound with a PDM microphone in csv format
> (with digital probe on quickfeather development board
> <https://www.quicklogic.com/products/eos-s3/quickfeather-development-kit/>)
> available in assets <https://github.com/Martoni/CIC/tree/main/assets>
> You received this message because you are subscribed to the Google
> Groups "chisel-users" group.
> To unsubscribe from this group and stop receiving emails from it, send
> an email to chisel-users...@googlegroups.com
> <mailto:chisel-users...@googlegroups.com>.
> To view this discussion on the web visit
> https://groups.google.com/d/msgid/chisel-users/798e8cfb-c135-4509-8e41-5e023eff2c11n%40googlegroups.com
> <https://groups.google.com/d/msgid/chisel-users/798e8cfb-c135-4509-8e41-5e023eff2c11n%40googlegroups.com?utm_medium=email&utm_source=footer>.
Thanks for trying out chiseltest. I am not sure what the cause of the
excess memory usage is, but I have a couple of questions:
When you observed the excess memory usage:
1) Were you using the Verilator backend or the default backend (which
will always be treadle)?
2) Did you have waveform dumping enabled?
With the default backend (treadle) and VCD writing on, one can very
quickly run into memory problems since treadle keeps the whole VCD in
memory and only writes to disk at the end of the simulation.
Looking at your testbench, the way that you load the pdm values might
use a lot of memory.
```.scala
val bis = new BufferedInputStream(new FileInputStream(pdmpath))
val pdm = Stream.continually(bis.read).takeWhile(-1 !=
_).map(_.toByte).toArray
bis.close
```
This code will load all pdm values into memory and they will stay there
until the end of your test. An alternative would be to keep the `bis`
opening at the beginning of the test, move the reading from the stream
into your testing loop and then only close the file after your test is
done. This way the whole file should never be in memory, only the chunks
that you are currently reading.
There could also be other causes but it will probably come down to
either chiseltest or the way you handle files. One way to debug this
would be do decouple both. You could remove the actual chiseltest code
and only load in the pdm file and save to an output file (with some
random data). On the other hand you could remove the pdm file loading
(substitute with random or constant data) and the file saving.
If either of these things leads to normal memory consumption, you know
that the other one is to blame.
I hope this helps and feel free to follow up with any further questions
you might have.
Good luck!
Kevin
On 8/26/21 5:41 AM, Martoni wrote:
> Hi all,
>
> I'm writting a CIC filter in Chisel3. The project is open source and
> available on github :
> https://github.com/Martoni/CIC
>
> To test it I recorded some sound with a PDM microphone in csv format
> (with digital probe on quickfeather development board
> available in assets <https://github.com/Martoni/CIC/tree/main/assets>
> directory of project.
>
> My goal is to use this real life PDM signal to feed the CIC and get back
> pcm signal to hear it with audacity software (because audacity have a
> cool raw import option :).
>
> At first I tryied to use chiselTester to read PDM file and simulate CIC
> then record PCM in binary file format. The simulation works
> <https://github.com/Martoni/CIC/blob/main/src/test/scala/CICSpec.scala>
>
> My goal is to use this real life PDM signal to feed the CIC and get back
> pcm signal to hear it with audacity software (because audacity have a
> cool raw import option :).
>
> At first I tryied to use chiselTester to read PDM file and simulate CIC
> then record PCM in binary file format. The simulation works
> on little samples, but if I try longer sample I rapidly get memory
> problems :
>
> [warn] In the last 10 seconds, 5.152 (51,7%) were spent in GC. [Heap:
> 0,01GB free of 1,00GB, max 1,00GB] Consider increasing the JVM heap
> using `-Xmx` or try a different collector, e.g. `-XX:+UseG1GC`, for
> better performance.
>
> I increased memory available with following SBT command argument :
>
> $ sbt -mem 8192
>
> And I can simulate longer sample. But the problem came back quickly and
> I have to add more and more memory.
>
> Is it normal that I need so much memory for simulation ? Or am I writing
> scala in the wrong way ?
>
> To compare simulation method I also wrote a C++ Verilator class
> simulation : https://github.com/Martoni/CIC/tree/main/verilator/cic
>
> This C++ simulation works without memory problem.
>
> I'm relatively new to Scala (I'm only at the middle of the Odersky book
> :) and I probably make some scala mistakes to eat so much memory no ?
>
> Thank you for reading this far
> Fabien Marteau
> Front de Libération des FPGA
> http://www.fabienm.eu/flf/
>
> --
> problems :
>
> [warn] In the last 10 seconds, 5.152 (51,7%) were spent in GC. [Heap:
> 0,01GB free of 1,00GB, max 1,00GB] Consider increasing the JVM heap
> using `-Xmx` or try a different collector, e.g. `-XX:+UseG1GC`, for
> better performance.
>
> I increased memory available with following SBT command argument :
>
> $ sbt -mem 8192
>
> And I can simulate longer sample. But the problem came back quickly and
> I have to add more and more memory.
>
> Is it normal that I need so much memory for simulation ? Or am I writing
> scala in the wrong way ?
>
> To compare simulation method I also wrote a C++ Verilator class
> simulation : https://github.com/Martoni/CIC/tree/main/verilator/cic
>
> This C++ simulation works without memory problem.
>
> I'm relatively new to Scala (I'm only at the middle of the Odersky book
> :) and I probably make some scala mistakes to eat so much memory no ?
>
> Thank you for reading this far
> Fabien Marteau
> Front de Libération des FPGA
> http://www.fabienm.eu/flf/
>
> You received this message because you are subscribed to the Google
> Groups "chisel-users" group.
> To unsubscribe from this group and stop receiving emails from it, send
> an email to chisel-users...@googlegroups.com
> <mailto:chisel-users...@googlegroups.com>.
> To view this discussion on the web visit
> https://groups.google.com/d/msgid/chisel-users/798e8cfb-c135-4509-8e41-5e023eff2c11n%40googlegroups.com
> <https://groups.google.com/d/msgid/chisel-users/798e8cfb-c135-4509-8e41-5e023eff2c11n%40googlegroups.com?utm_medium=email&utm_source=footer>.
Martoni
Aug 26, 2021, 2:17:58 PM8/26/21
to chisel-users
Hi Kevin,
thank for the quick response.
1) Were you using the Verilator backend or the default backend (which
will always be treadle)?
I tested both, and have nearly the same memory problem.
2) Did you have waveform dumping enabled?
No, to test with waveform dumping I'm using the "-DwriteVcd=1" option. But for PDM computation I don't.
With the default backend (treadle) and VCD writing on, one can very
quickly run into memory problems since treadle keeps the whole VCD in
memory and only writes to disk at the end of the simulation.
Ok.
Looking at your testbench, the way that you load the pdm values might
use a lot of memory.
```.scala
val bis = new BufferedInputStream(new FileInputStream(pdmpath))
val pdm = Stream.continually(bis.read).takeWhile(-1 !=
_).map(_.toByte).toArray
bis.close
```
This code will load all pdm values into memory and they will stay there
until the end of your test. An alternative would be to keep the `bis`
opening at the beginning of the test, move the reading from the stream
into your testing loop and then only close the file after your test is
done. This way the whole file should never be in memory, only the chunks
that you are currently reading.
Ok but my pdm file is only 23MB and I have 64GB of ram, even with sbt configuration I'm using 8GB of ram for java JVM. You think this ridiculous 23MB file can be a problem in memory ?
If I close bis at the end of simulation I've the same behavior.
There could also be other causes but it will probably come down to
either chiseltest or the way you handle files. One way to debug this
would be do decouple both. You could remove the actual chiseltest code
and only load in the pdm file and save to an output file (with some
random data). On the other hand you could remove the pdm file loading
(substitute with random or constant data) and the file saving.
If either of these things leads to normal memory consumption, you know
that the other one is to blame.
Ok I will try this.
I hope this helps and feel free to follow up with any further questions
you might have.
Yes.
Good luck!
Thanks again.
Martoni
Aug 27, 2021, 8:48:22 AM8/27/21
to chisel-users
Hi again,
I did some tests with memory monitoring :
```scala
val runtime = Runtime.getRuntime
def getMemoryUsage(): Long = {
val mb = 1024*1024
(runtime.totalMemory - runtime.freeMemory)/mb
}
val mb = 1024*1024
(runtime.totalMemory - runtime.freeMemory)/mb
}
```
- saving values: Each 1000 pcm output value I printed also memory usage. I plotted it with matplotlib, the result is available in attachement:
```
if(pcmsamples % 1000 == 0){
val memUsage = getMemoryUsage()
println(s"Mem: $memUsage, |pcmsamples $pcmsamples -> $pcmvalue. Mem: $memUsage,")
}
val memUsage = getMemoryUsage()
println(s"Mem: $memUsage, |pcmsamples $pcmsamples -> $pcmvalue. Mem: $memUsage,")
}
```
result in blue curve.
- no saving values : I commented output saving pcm code :
```
//val pcmFile = new BufferedOutputStream(new FileOutputStream(s"$pdmpath.pcm"))
...
//pcmFile.write((Array[Byte](0,0) ++ pcmarray).takeRight(2))
...
// //pcmFile.close()
```
The result is given with the yellow curve.
- I disconnected pdm file reading replaced it with random values :
```
//val pdm = Stream.continually(bis.read).takeWhile(-1 != _).map(_.toByte).toArray
val pdm = for(i <- 0 to 24*1024*1024) yield if(randbool.nextBoolean) {1} else {0}
val pdm = for(i <- 0 to 24*1024*1024) yield if(randbool.nextBoolean) {1} else {0}
```
Result on green curve
- I tryied to save trace with option :
```
testOnly cic.BasicTest -- -DwriteVcd=1
```
Memory result is on red curve. I generated a ~800 MB vcd file but memory usage in RAM seems to be equal.
- Finally I tested the «treadle» simulator instead of verilator :
```
//test(new CIC(c=MyCICParams)).withAnnotations(Seq(VerilatorBackendAnnotation)) { dut =>
test(new CIC(c=MyCICParams)) { dut =>
test(new CIC(c=MyCICParams)) { dut =>
```
I couldn't finish the simulation and memory usage was far more important than verilator backend.
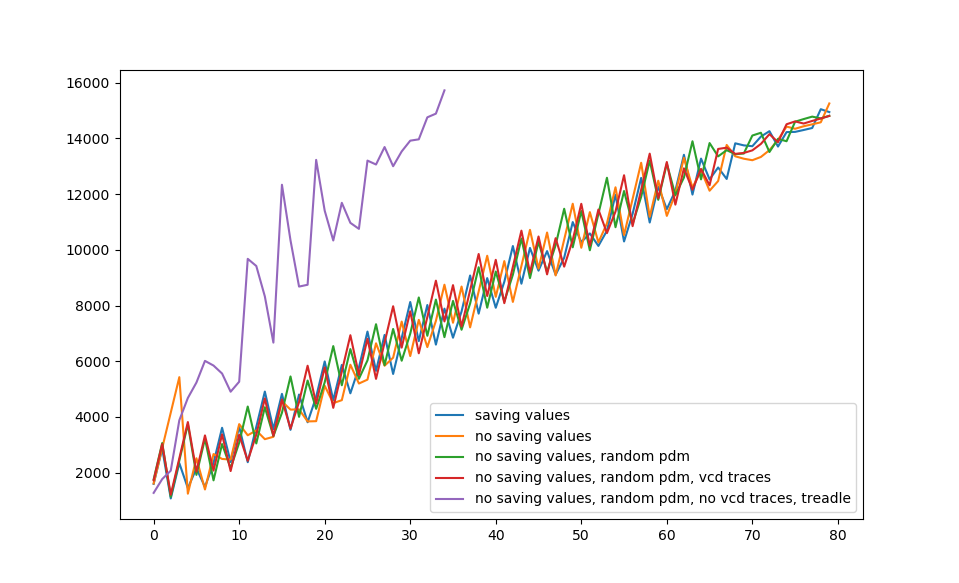
My conclusions :
- Memory usage is increasing linearly over cycles
- Treadle eat more memory than Verilator
- VCD recording option doesn't change memory usage (but maybe was never be disconnected).
- For the moment I have no other solution than increasing JVM memory before launch simulation, and limit simulation time.
Fabien
Martoni
Sep 6, 2021, 7:29:12 AM9/6/21
to chisel-users
Hello,
So, do you think it's possible to improve the performances of this test ? Or do I have to use Verilator ?
Thanks
Fabien
Reply all
Reply to author
Forward
0 new messages