When to sell?
1 view
Skip to first unread message

Chawanni Advice
Sep 6, 2009, 10:35:09 AM9/6/09
to chaw...@googlegroups.com
Investors in the equity market, have always had this question when to
sell-off a stock. The investors want some kind of indicator to say
whether the stock has reached its ( almost ) maximum and the only
movement in its price henceforth will be downwards.
I'm not talking about Technical analysis here and I can't give you a formula to analyse an individual stock but this graph on Sanjay Bakshi's blog could give you an indication whether the equity market as a whole has become over-heated and it is time to sell-off.
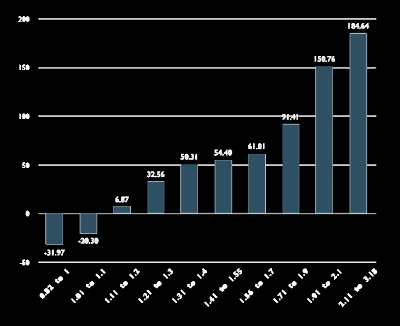
The above graph has been created by plotting the Nifty dividend yield against the returns generated by Nifty over the next 3 years.
Thus, all an investor has to do is monitor the Nifty dividend yield and sell-off if it falls below 1.2% ( or whatever threshold you would like to set based on the above graph ).
However, there are few thing you need to keep in mind:
1. The above graph was based on historical values of Nifty and individual stocks may not follow a similar pattern. Thus this graph is more helpful to those who invest in index funds but can also be used as a reference by other investors.
2. The above graph considers returns generated over the subsequent 3 years, but the graph for investors with a different time horizon may look slightly different.
Please read this complete article by Sanjay Bakshi to know why he has made use of Dividend yield instead of P/E or P/B to plot this graph and also his view on the current market run-up.
The original article can be found here:
http://chawanni.blogspot.com/2009/09/when-to-sell.html
I'm not talking about Technical analysis here and I can't give you a formula to analyse an individual stock but this graph on Sanjay Bakshi's blog could give you an indication whether the equity market as a whole has become over-heated and it is time to sell-off.

( Image Copyright owned by Sanjay Bakshi )
The above graph has been created by plotting the Nifty dividend yield against the returns generated by Nifty over the next 3 years.
Thus, all an investor has to do is monitor the Nifty dividend yield and sell-off if it falls below 1.2% ( or whatever threshold you would like to set based on the above graph ).
However, there are few thing you need to keep in mind:
1. The above graph was based on historical values of Nifty and individual stocks may not follow a similar pattern. Thus this graph is more helpful to those who invest in index funds but can also be used as a reference by other investors.
2. The above graph considers returns generated over the subsequent 3 years, but the graph for investors with a different time horizon may look slightly different.
Please read this complete article by Sanjay Bakshi to know why he has made use of Dividend yield instead of P/E or P/B to plot this graph and also his view on the current market run-up.
The original article can be found here:
http://chawanni.blogspot.com/2009/09/when-to-sell.html
Reply all
Reply to author
Forward
0 new messages