Request for a buffer to display local vars

Quentin de Laroussilhe
When I use cgdb I think this to s laborious to have to constantly use 'info loc' to inspect local variables. I think this could be a great idea to display this variables in a buffer.

Serge Voilokov
Hi,
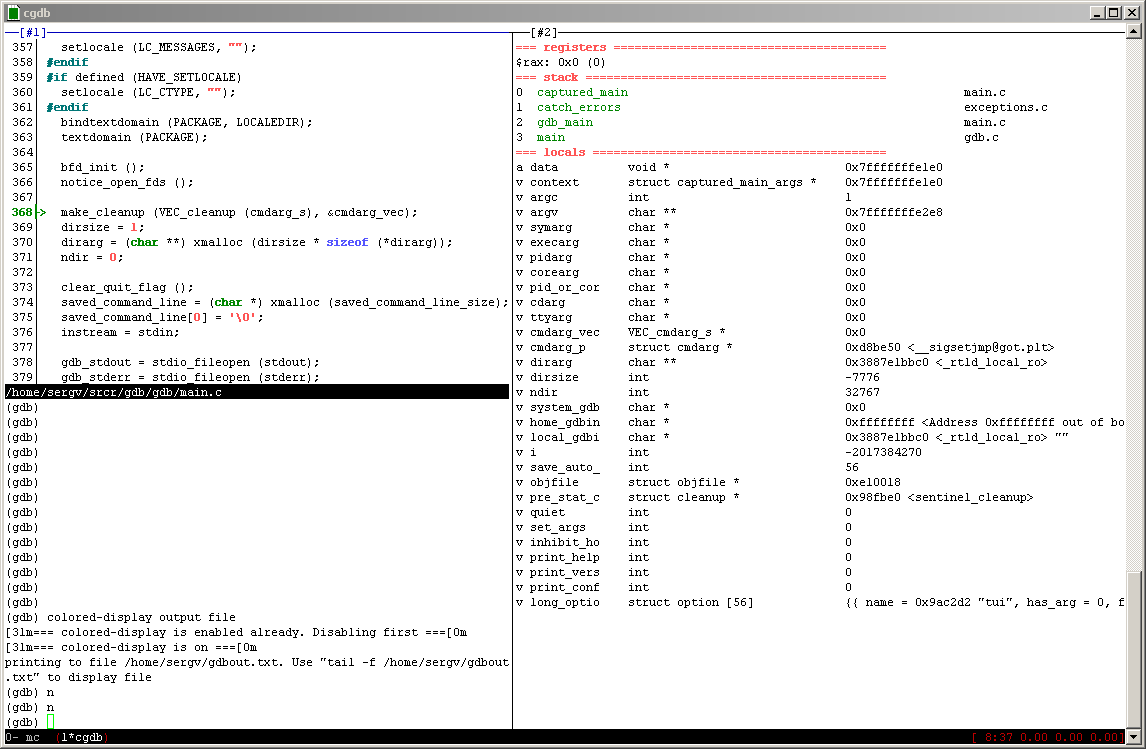
For displaying locals, stack and registers while stepping in cgdb I am using following method.
I wrote python extension for gdb which dumps all info to the separate file.
cgdb and "tail -f outfile.txt" are running both in tmux or dvtm splitted screens (see screenshot).
Python hook on each stop event in gdb (step, next, until, etc) updates second part of the screen.
How to use it:
- gdb should have python support
- make 2 split panes in dvtm or tmux (or run tail in the separate terminal)
then run in first pane:
wget https://raw.github.com/serge-v/cgdb/master/lib/python/colored_display.py
cgdb
source colored_display.py
colored-display output file
in second pane or in second terminal run:
tail -f ~/gdbout.txt
These lines can be added to .gdbinit to enable it at gdb startup:
source colored_display.py
colored-display output file
Regards,
Serge

Douglas Roffel

William.Leo

1. The left windows are source and gdb as before, right windows are var(watch, mem) and stack(thread, break) tab controls. There is a vertical line between of them, and it can be move by hot key. The right tow tab controls also can increase or decrease height by '+' / '-', just like left windows.
2. All tab pages can be activated by hotkey, when focus is not on gdb window. And switch focus back to source by 'Esc', or gdb by 'i'.
3. Var tab page display result of "info locals" and "info args" for current frame. If execute 'next', and some variable's value change, the value will be highlight as red
4. Stack tab page display current call stack, result of "backtrace", current frame will be highlight as BOLD attribute.
5. Thread tab page display all thread info, also highlight current thread.
6. Break tab page display breakpoint, enable break highlighted as red, disable is yellow, this is same as source window.
7. All tab pages will keep sync with gdb operation.


在 2012年9月16日星期日 UTC+8上午8:33:23,Quentin de Laroussilhe写道:

Robert Rossi
--
You received this message because you are subscribed to the Google Groups "cgdb" group.
To unsubscribe from this group and stop receiving emails from it, send an email to cgdb-users+unsubscribe@googlegroups.com.
To post to this group, send email to cgdb-...@googlegroups.com.
To view this discussion on the web visit https://groups.google.com/d/msgid/cgdb-users/29ebed9e-f635-4dc6-8c87-b6a50981ca34%40googlegroups.com.
William.Leo
在 2017年2月18日星期六 UTC+8下午8:42:24,Bob Rossi写道:
Bob RossiThanks,rebasing this work on master. A lot has changed since 0.6.8.I can take a look at reviewing this, but I think that it might make sense to considerHi William,This looks incredible neat.
On Sat, Feb 18, 2017 at 4:50 AM, William.Leo <willi...@gmail.com> wrote:
I finished this feature base on 0.6.8, not only locals but also args, stack, thread and breakpoint. They are displayed on right side of source and gdb windows. The default layout as following screen shot
1. The left windows are source and gdb as before, right windows are var(watch, mem) and stack(thread, break) tab controls. There is a vertical line between of them, and it can be move by hot key. The right tow tab controls also can increase or decrease height by '+' / '-', just like left windows.
2. All tab pages can be activated by hotkey, when focus is not on gdb window. And switch focus back to source by 'Esc', or gdb by 'i'.
3. Var tab page display result of "info locals" and "info args" for current frame. If execute 'next', and some variable's value change, the value will be highlight as red
4. Stack tab page display current call stack, result of "backtrace", current frame will be highlight as BOLD attribute.
5. Thread tab page display all thread info, also highlight current thread.
6. Break tab page display breakpoint, enable break highlighted as red, disable is yellow, this is same as source window.
7. All tab pages will keep sync with gdb operation.
All of these features finished just about 1 month ago, not enough test. I hope someone can help me finish test. Then maybe add into next version cgdb.
在 2012年9月16日星期日 UTC+8上午8:33:23,Quentin de Laroussilhe写道:Hello,
When I use cgdb I think this to s laborious to have to constantly use 'info loc' to inspect local variables. I think this could be a great idea to display this variables in a buffer.
--
You received this message because you are subscribed to the Google Groups "cgdb" group.
To unsubscribe from this group and stop receiving emails from it, send an email to cgdb-users+...@googlegroups.com.
To post to this group, send email to cgdb-...@googlegroups.com.
Robert Rossi
Give us plenty of time to get it right.
To unsubscribe from this group and stop receiving emails from it, send an email to cgdb-users+unsubscribe@googlegroups.com.
To post to this group, send email to cgdb-...@googlegroups.com.
To view this discussion on the web visit https://groups.google.com/d/msgid/cgdb-users/2286d306-5309-44f8-a451-555a91566c03%40googlegroups.com.
Robert Rossi
William.Leo
在 2017年2月20日星期一 UTC+8上午10:45:55,Bob Rossi写道:
William.Leo
在 2017年2月20日星期一 UTC+8上午10:45:55,Bob Rossi写道:
I'm actually changing the commands file as we speak.
